Edmonton’s Urban Planning Committee will discuss an interim report on District Planning on December 5. District planning will define the borders of and development policies applied to “nodes and corridors” where site-specific rezonings for higher density are likely to be supported. As I’ve said before, I generally disagree with the node and corridor approach, but that is the scope of the initiative.
As I wrote in my post on McKernan/Belgravia Station, I believe that Edmonton is missing out on an opportunity to encourage transit-oriented development (TOD) around some LRT stations in secondary corridors. With Avonmore Stop, we have an LRT station that is not even in a secondary corridor or node or anything that would encourage higher density beyond the 8 units and 10.5m allowed in the base RS zone. We can do better, especially when we use BC’s new TOD legislation as inspiration.
In this post, we’ll take a closer look at Avonmore Stop, opened just a month ago on the new Valley Line. I’ve copy-pasted the relevant primer on district planning in Section 1, crunched the numbers on growth over the past 20 years in Section 2, and shown how little additional density is planned in Section 3.
Nodes and corridors primer
The City Plan and draft district policy define secondary corridors as:
areas along prominent residential and commercial streets that serve as a local destination for surrounding Neighbourhoods. They connect to Nodes, feature diverse travel modes and may evolve as more commercial or residential over time.
Secondary corridors will support low-rise (up to 4 storeys) throughout and mid-rise along the main streets. Transition to lower density will be supported along the edges of secondary corridors. There are no provisions for additional density within secondary corridors near rapid transit stations or around rapid transit stations that are not within a node or corridor.
Local nodes:
serve Neighbourhoods through a mix of commercial uses, civic spaces and centres, cultural facilities, places of worship and schools. Local Nodes function as focal points for housing, business, services and gathering for one or a small set of Neighbourhoods.
Local nodes will support low-rise development throughout and mid-rise along main streets where “site size and context allow for appropriate transition to surrounding development.”
Stagnation
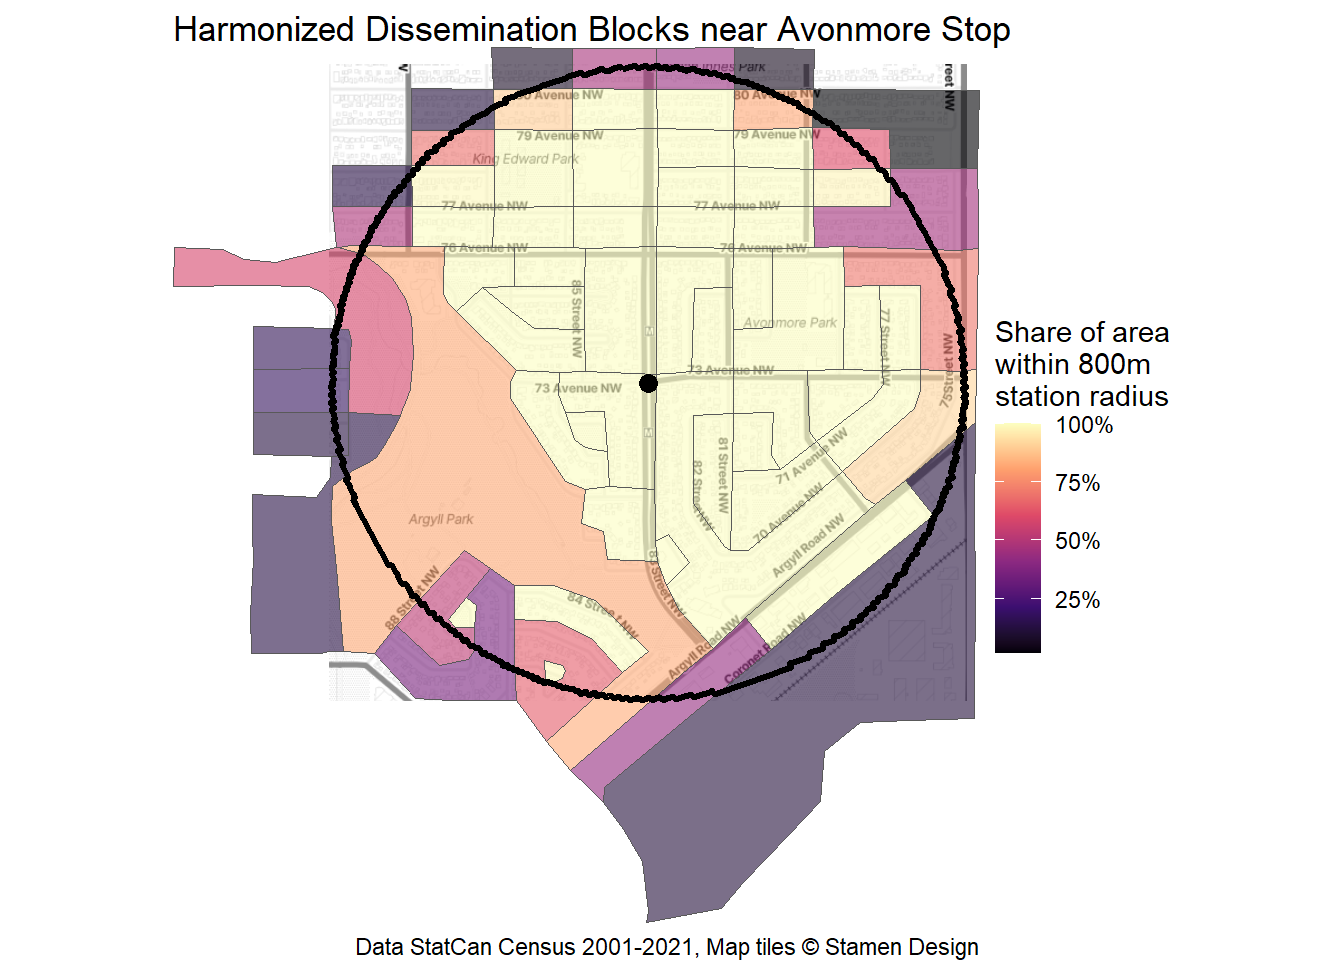
Let’s take a look at how the area around Avonmore Stop area has grown – or not – over the past 20 years. To start off, I’ve defined the station area as extending 800m from the platforms on 83 St at 73 Ave. This aligns with the largest radius of BC’s new TOD policy and is generally a 10-15 minute walk away.
This section is inspired and much of the code is copied from Jens von Bergmann’s blog post on Nanaimo Station in Vancouver.
Census data has what we need, but census dissemination blocks (DBs) don’t perfectly line up with the 800m radius and their borders change from census to census. First, I harmonized the 2001-2021 DBs to a common geography using the TongFen library. Then, I selected the DBs that are more than 50% within the station area, shown in Figure 2.
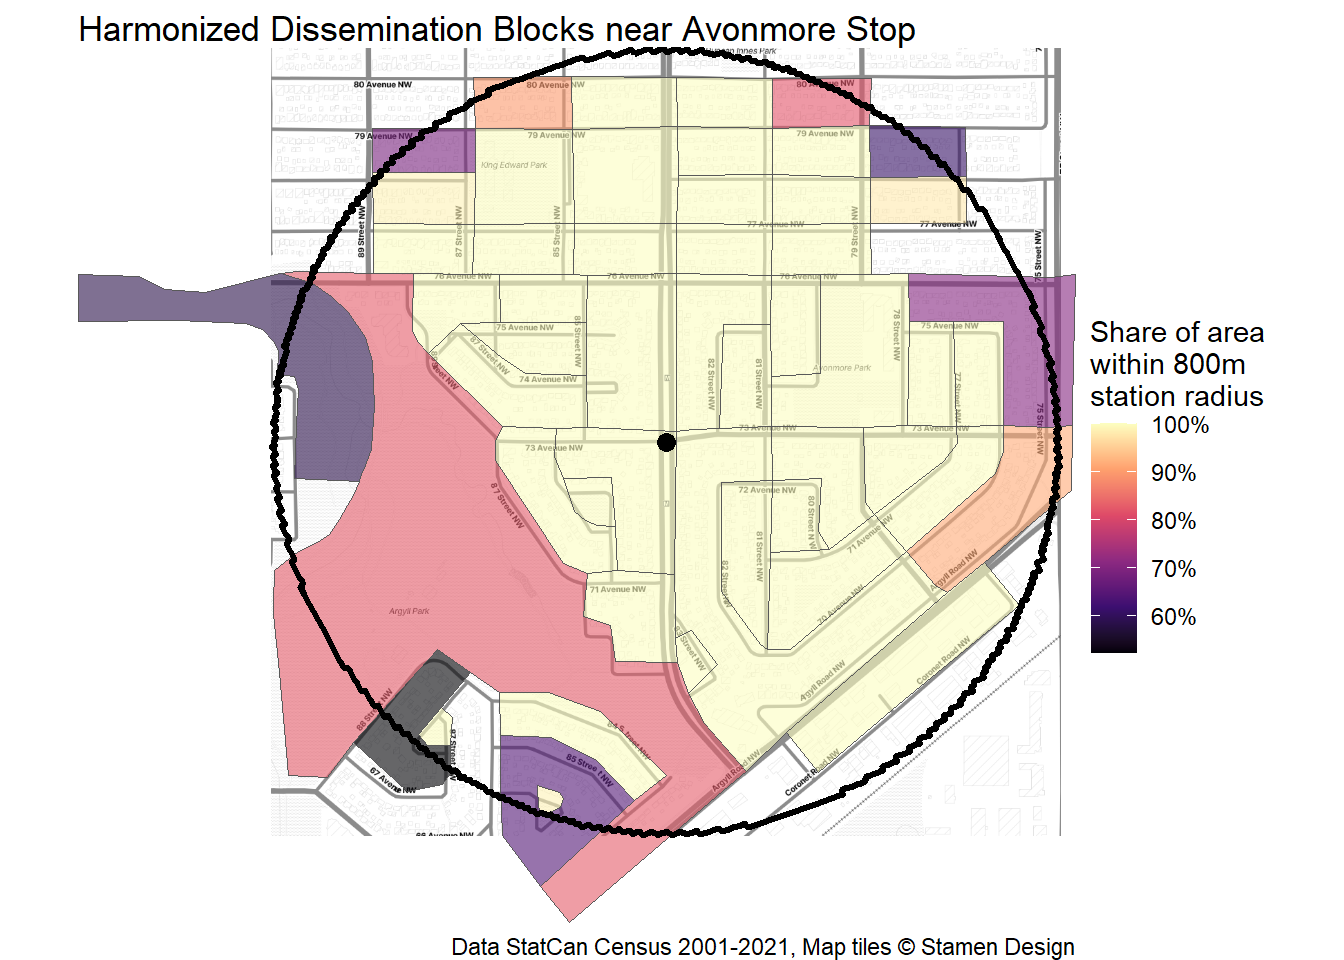
Figure 3 shows only the DBs considered to be within Avonmore Stop area by the simple 50% inclusion rule. These DBs form the “census station area” that will be used from here on.
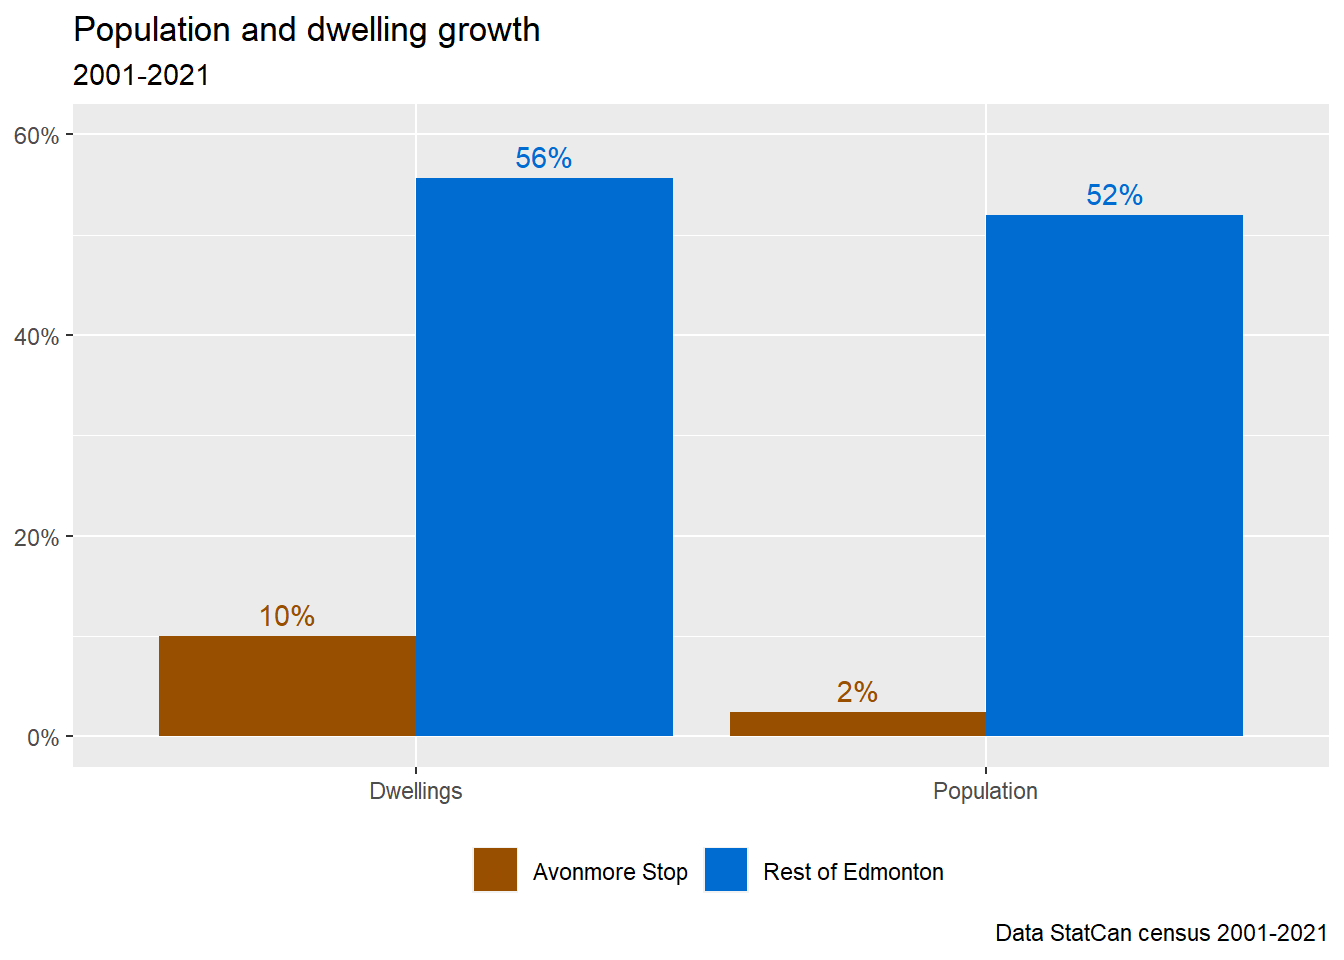
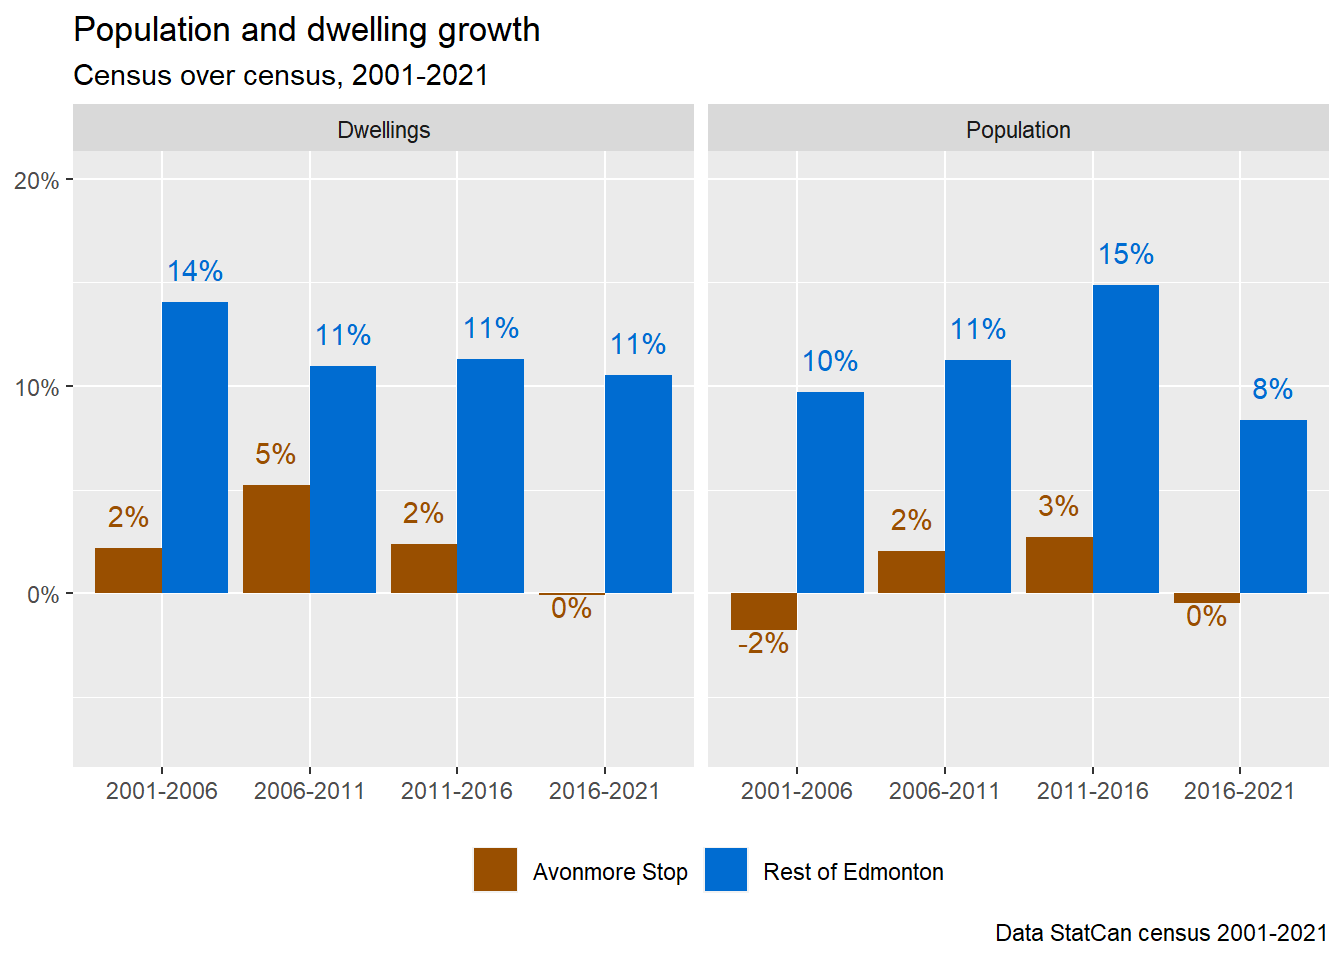
Now that the census station area is well-defined, we can divide Edmonton into the Avonmore Stop area and the Rest of Edmonton. As shown in Figure 4, neither dwellings nor population has grown significantly over the past two decades.
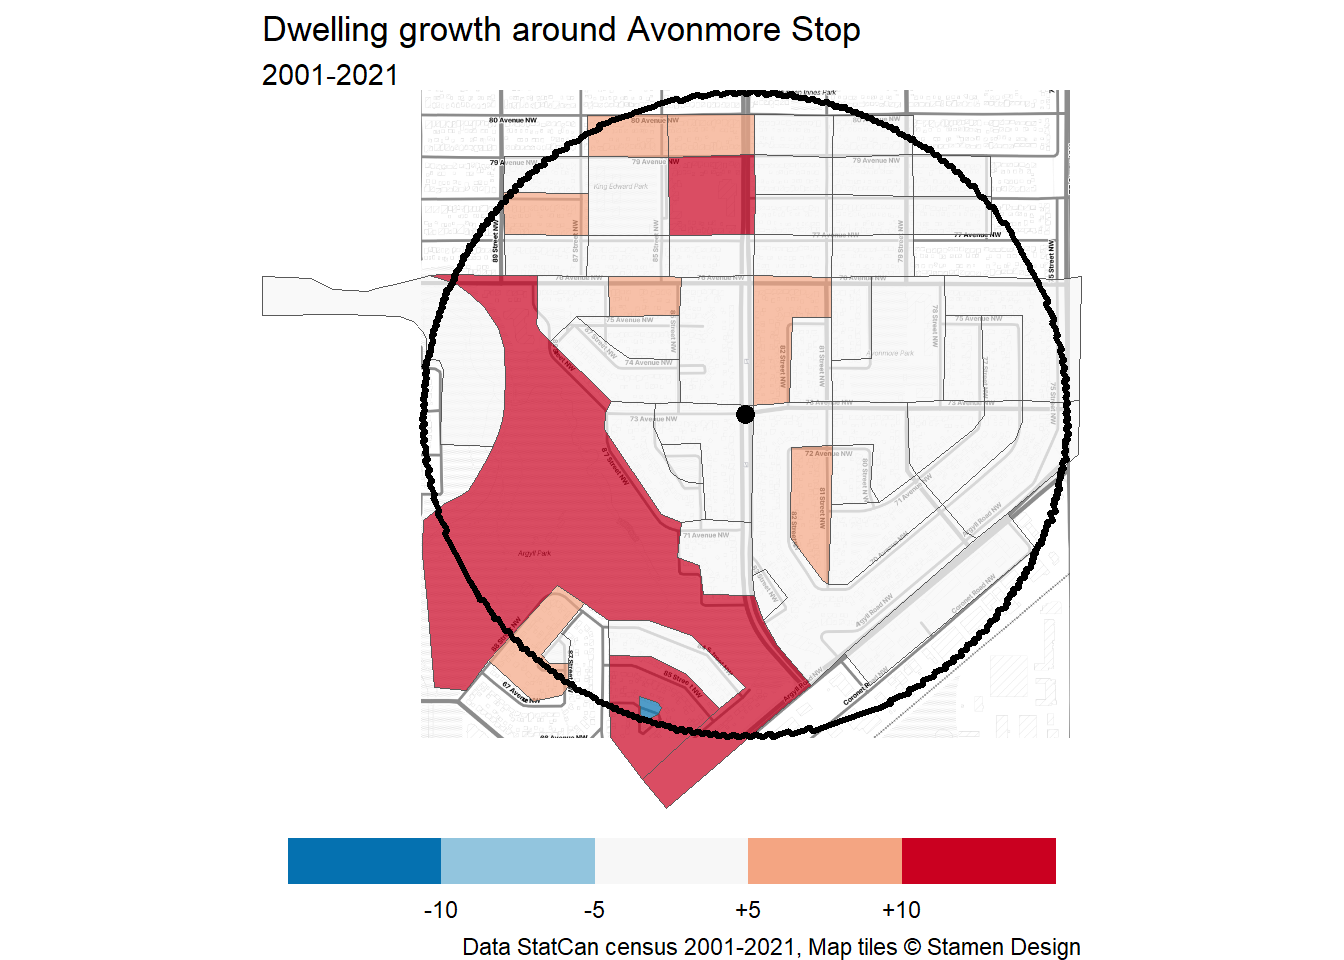
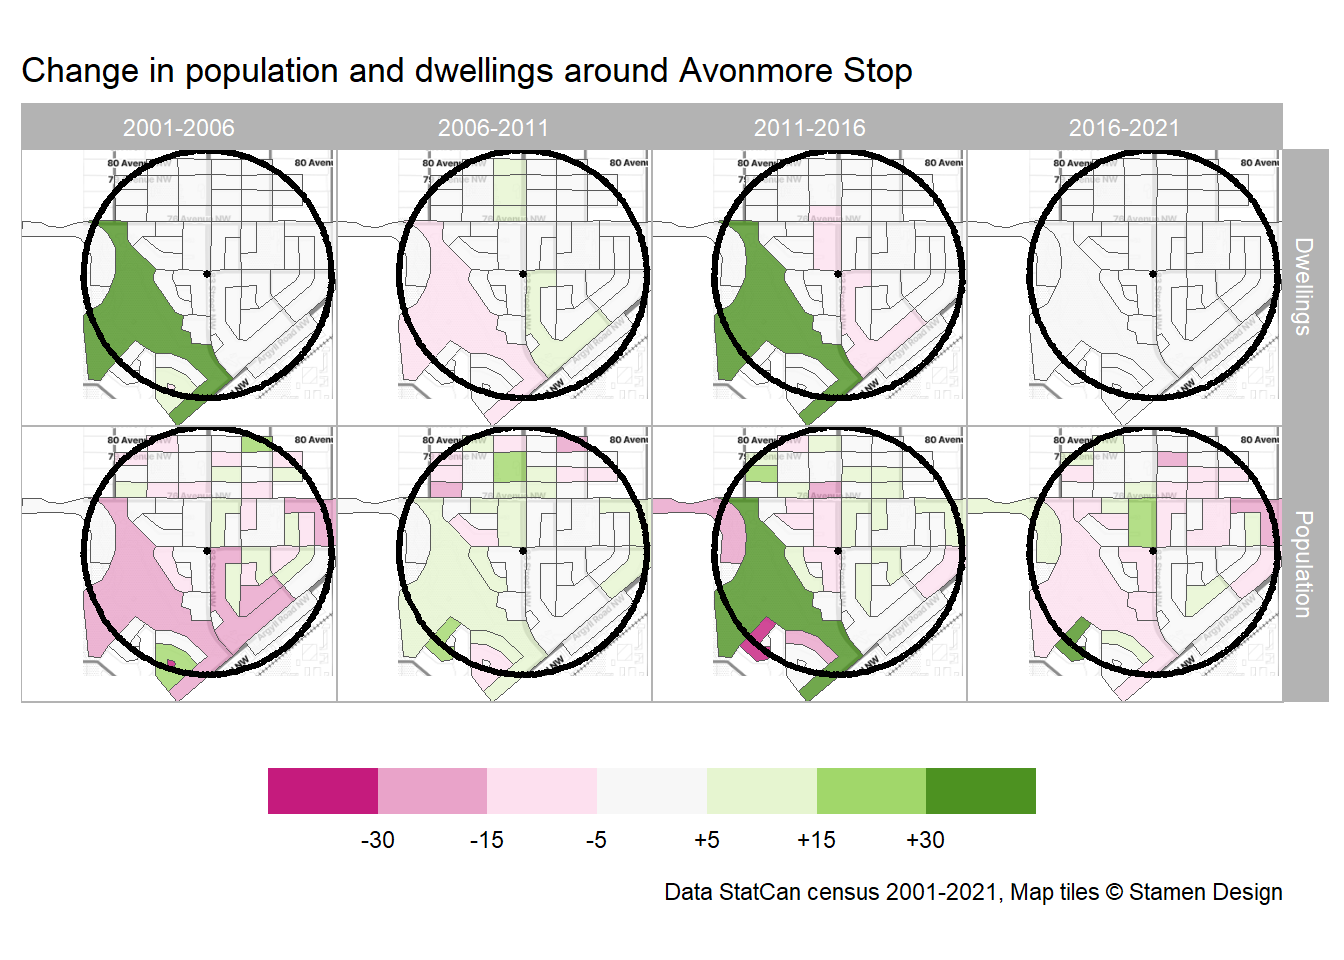
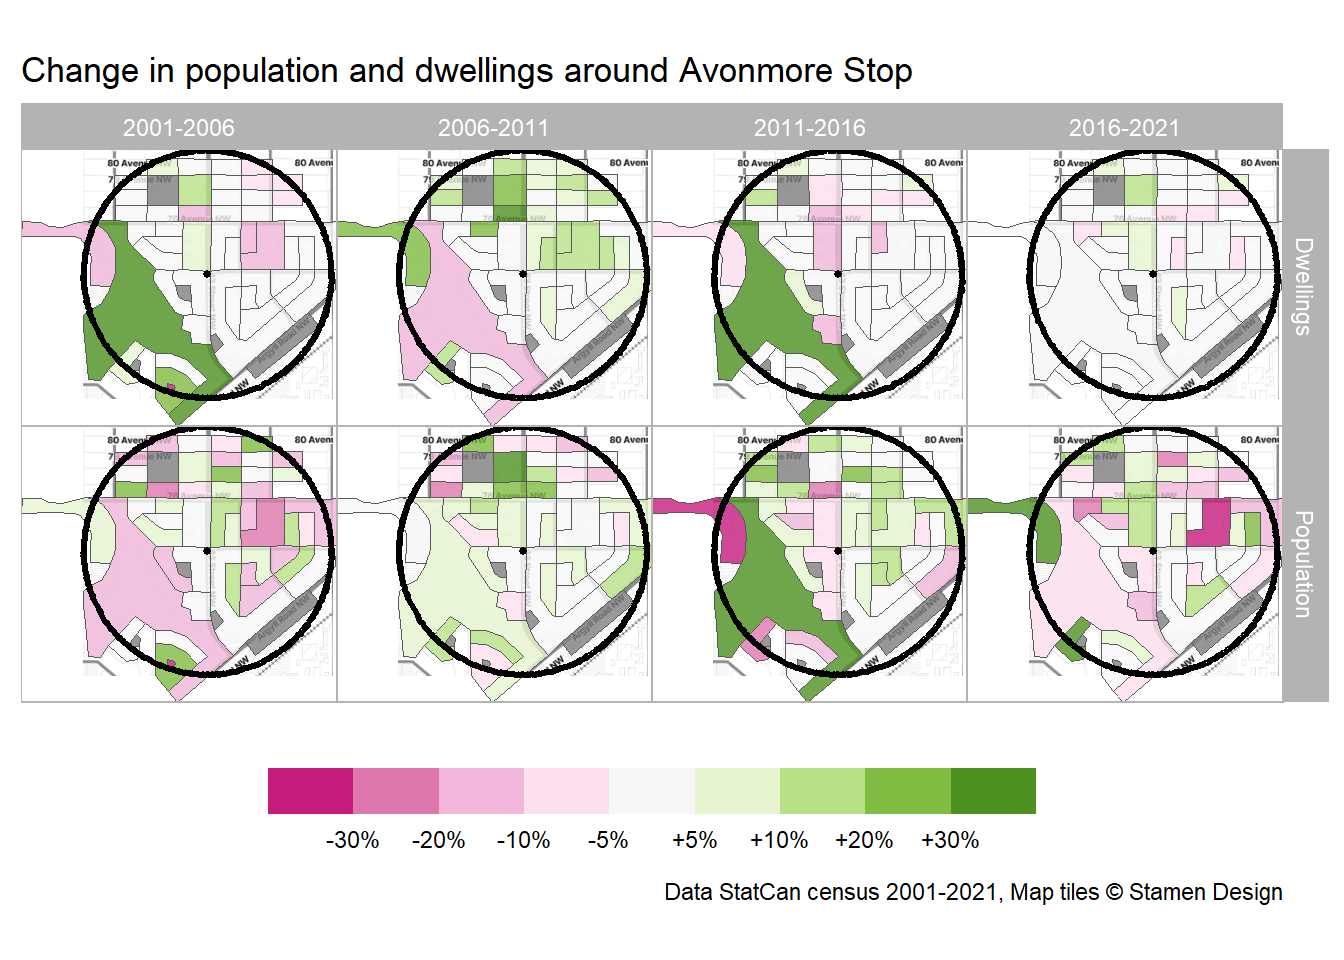
Since we have data on a DB level, we can also look at population and dwelling growth spatially in Figure 5 and Figure 6. It’s really a few DBs that have grown, the rest either declined or remained stagnant.
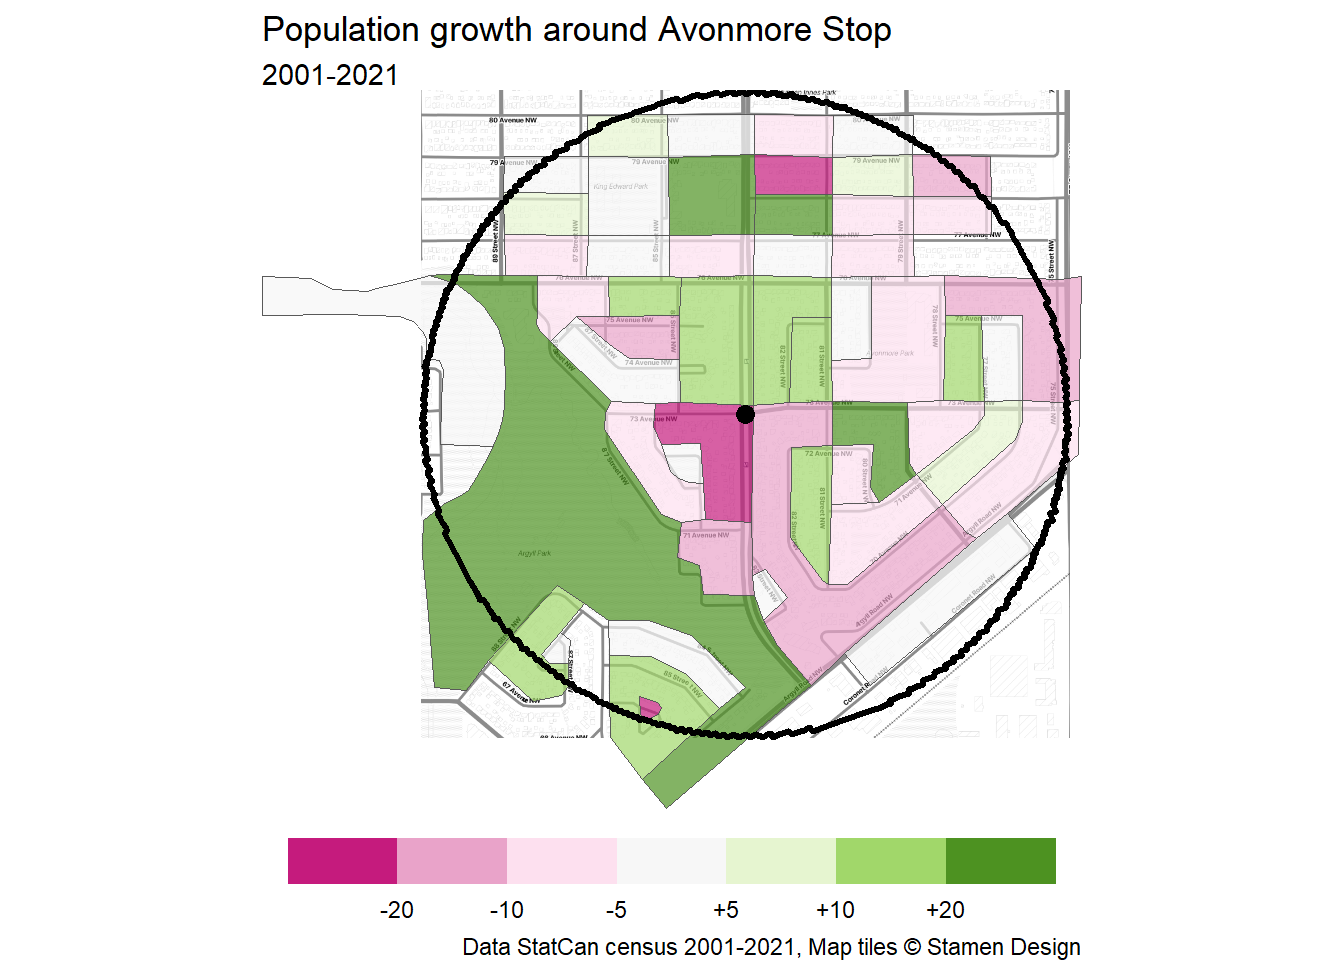
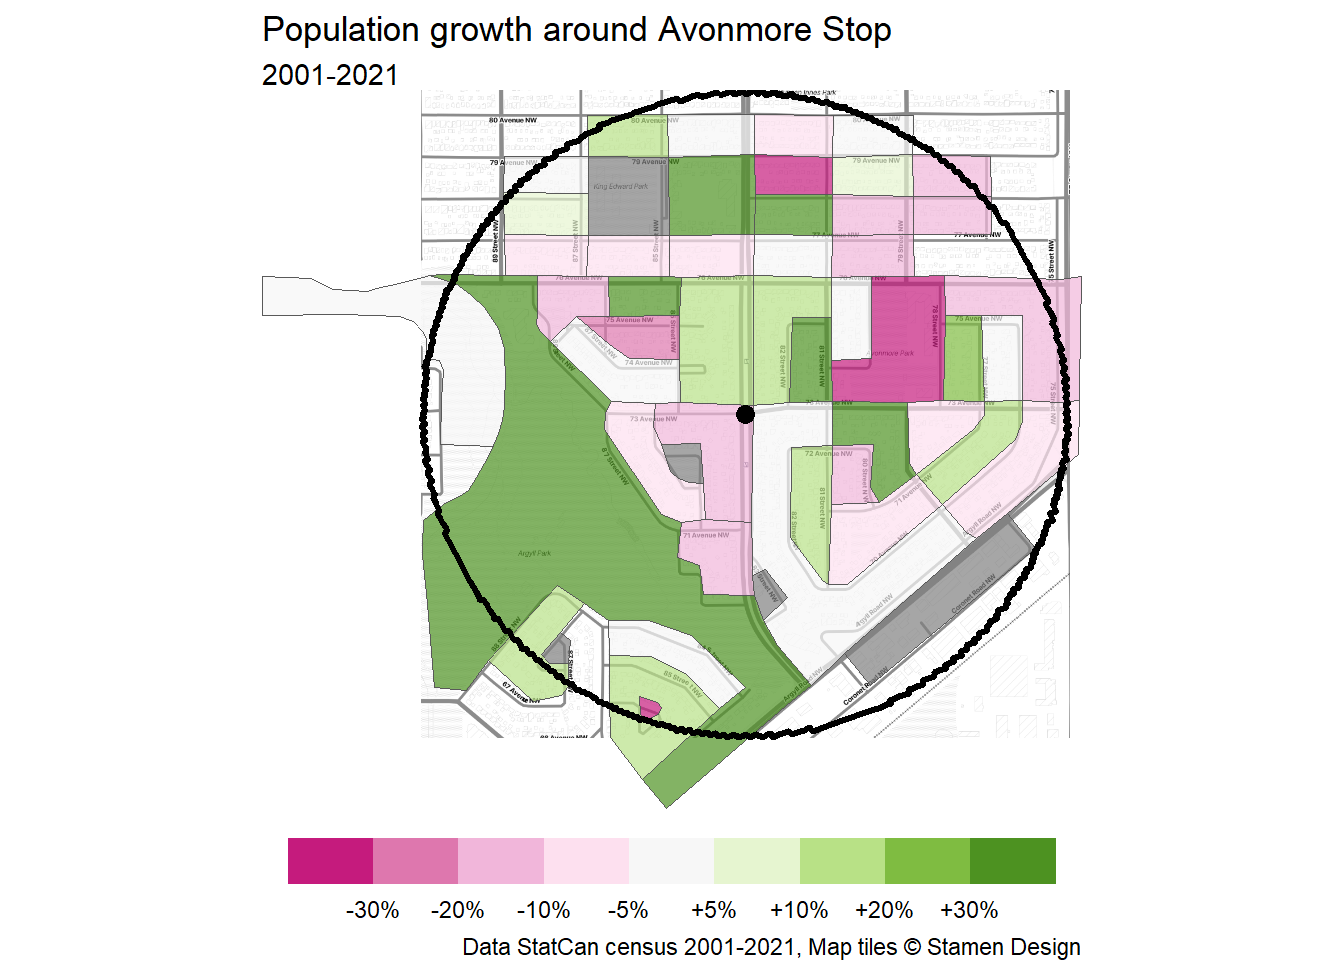
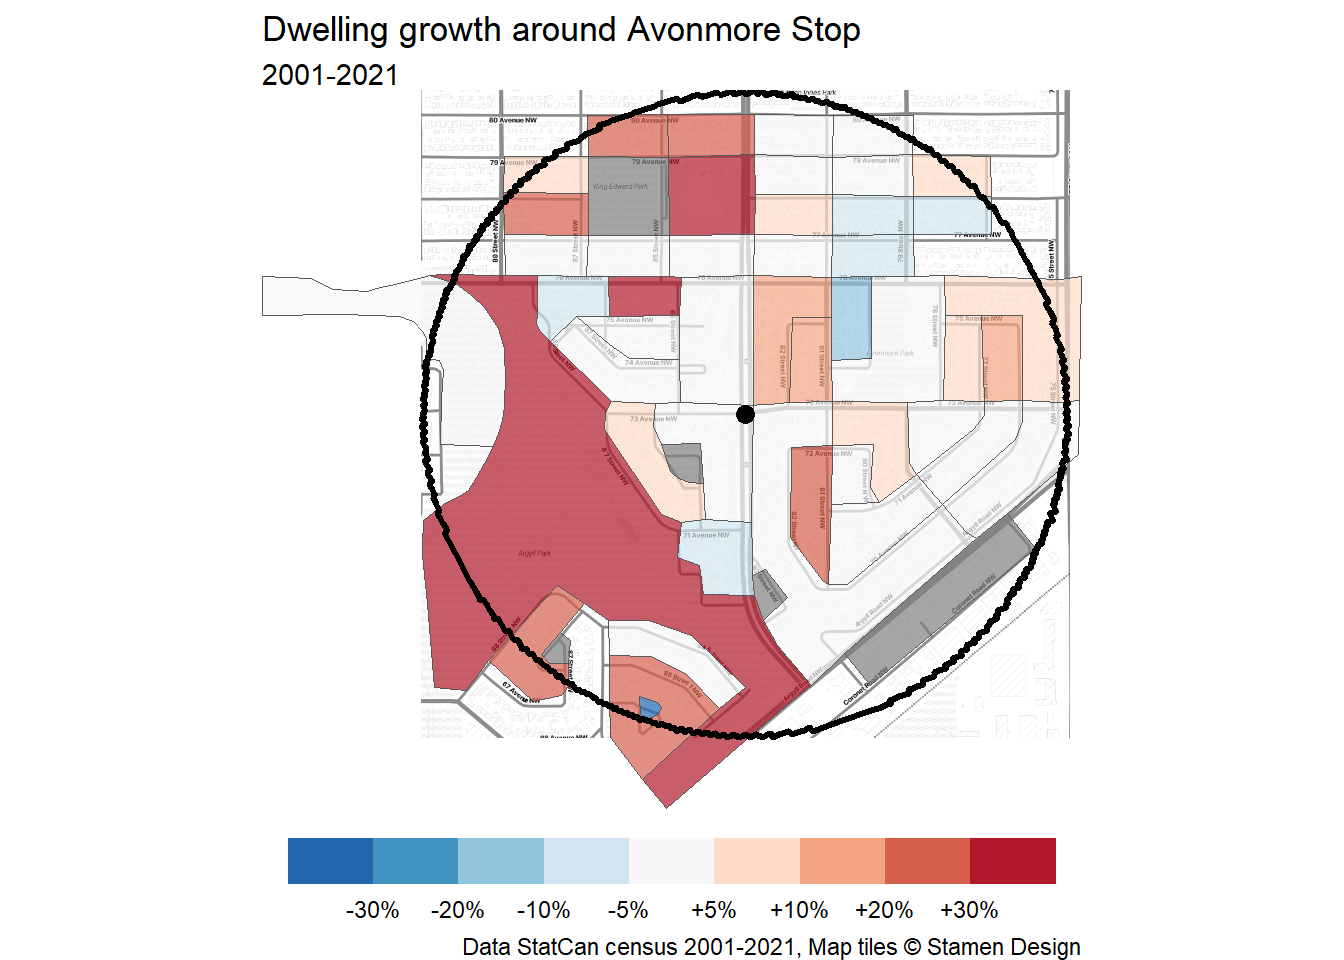
Since we have data from multiple censuses, we can also track change census-over-census, every five years from 2001 in Figure 7. Like McKernan/Belgravia, Avonmore remained relatively static in every census period.
Once again, we can break down the census-over-census change by DB, as shown in Figure 8 and Figure 9. Notably, the large DB that covers Mill Creek Ravine seems to have staggered dwelling and population growth, from what seems to be the construction of the Conservatory Condominiums in 2005 and subsequent occupancy.
No TOD here
While the census shows what happened in the past, zoning and district plans together show what we can expect for the future. Data for the new zoning is now available on Edmonton’s open data portal. Data for the nodes and corridors of district planning is not available so I have drawn these borders manually based on the images in the Southeast district plan.
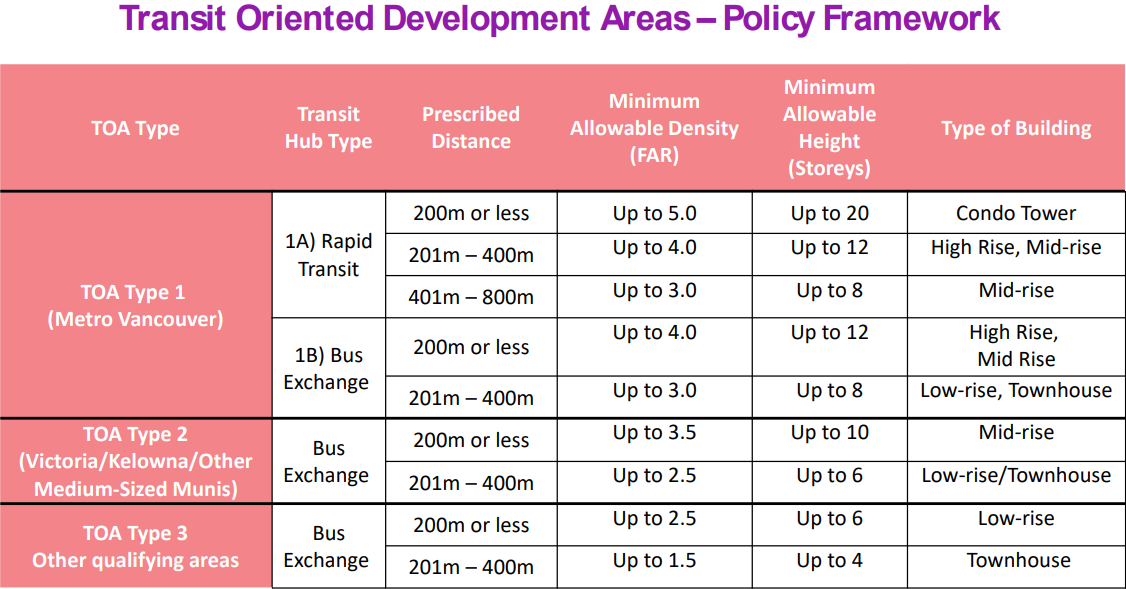
Figure 10 shows the zoning (as of January 1, 2024) and proposed nodes and corridors within the Avonmore Stop area. I have also overlaid smaller radii to compare Edmonton’s plan with BC’s new transit-oriented development legislation that will permit 20 storeys within 200m, 12 storeys within 400m and 8 storeys within the full 800m. It is solidly a low-rise zone area, with only some specific sites zoned for any higher density.
Looking at the nodes and corridors map, we can see that there was no effort to include the LRT station within a node or corridor. Instead, there is a parallel secondary corridor running along 75 St and a bit of Argyll Road to the southeast. That means that only 11% of the station area will be covered by this secondary corridor, which is more of a coincidence than anything.
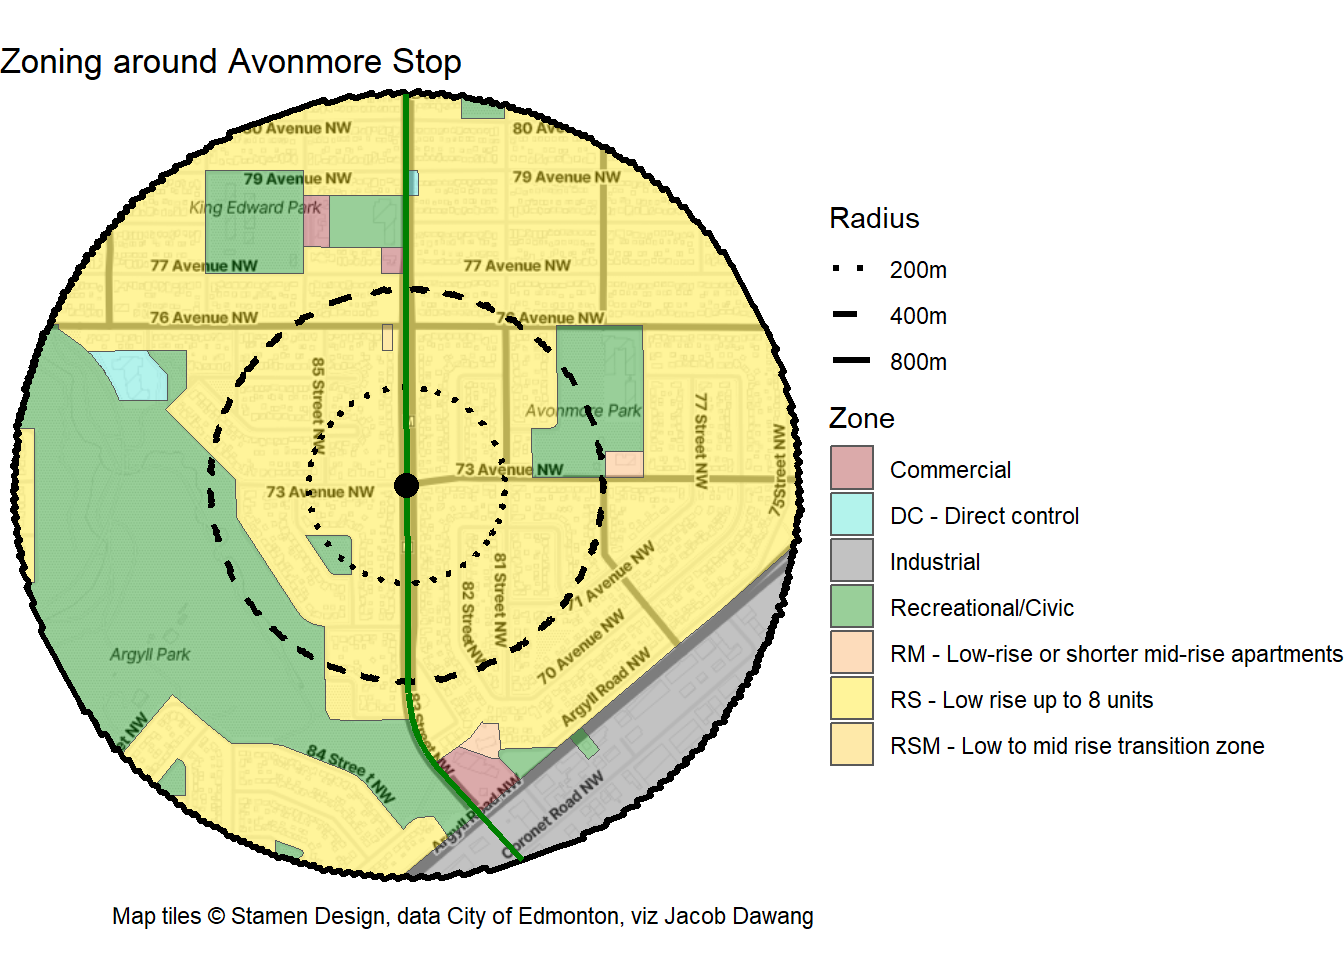
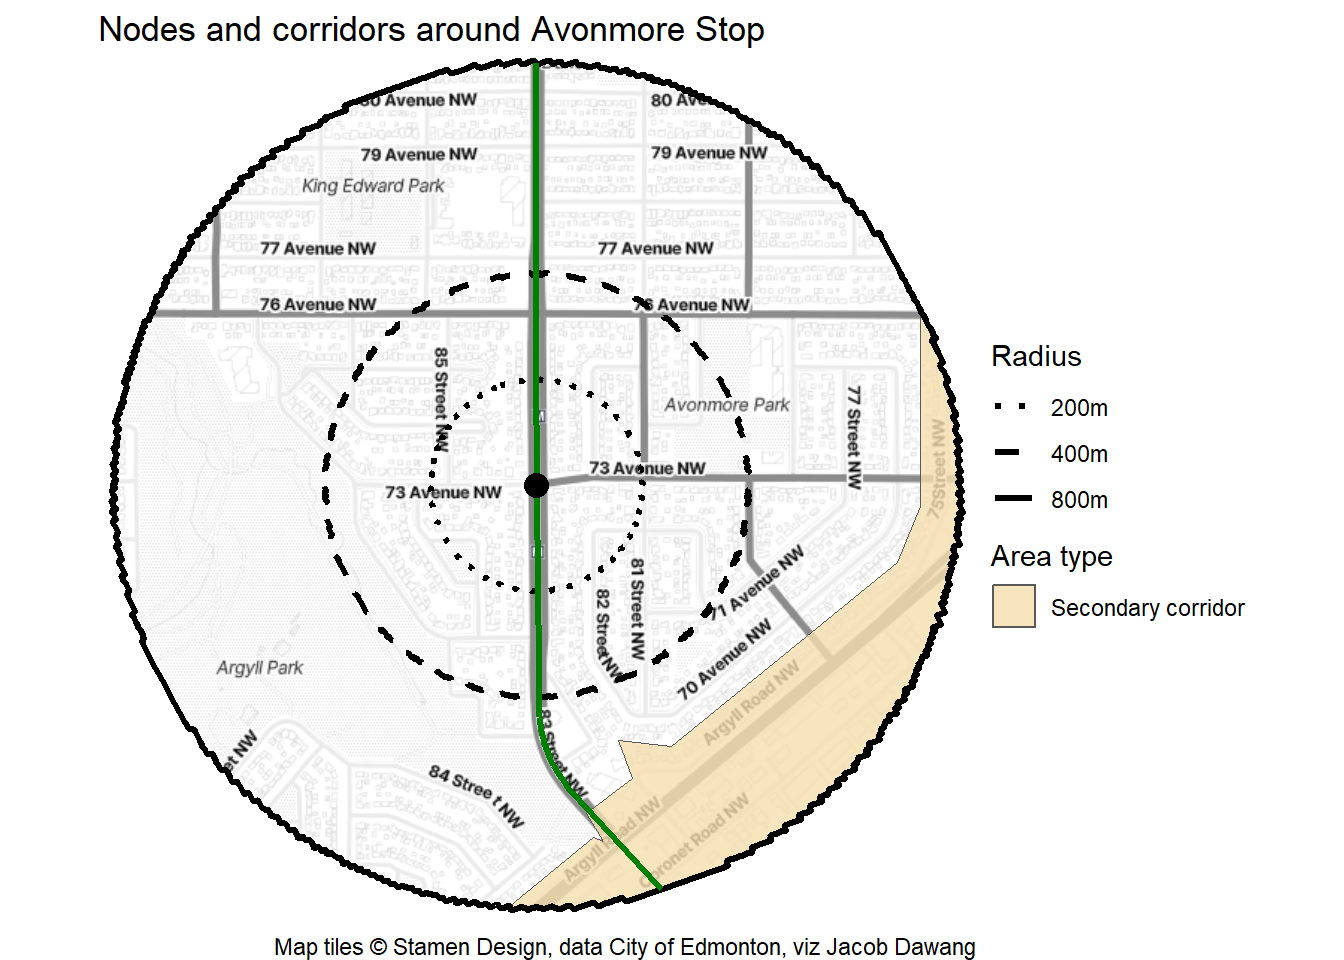
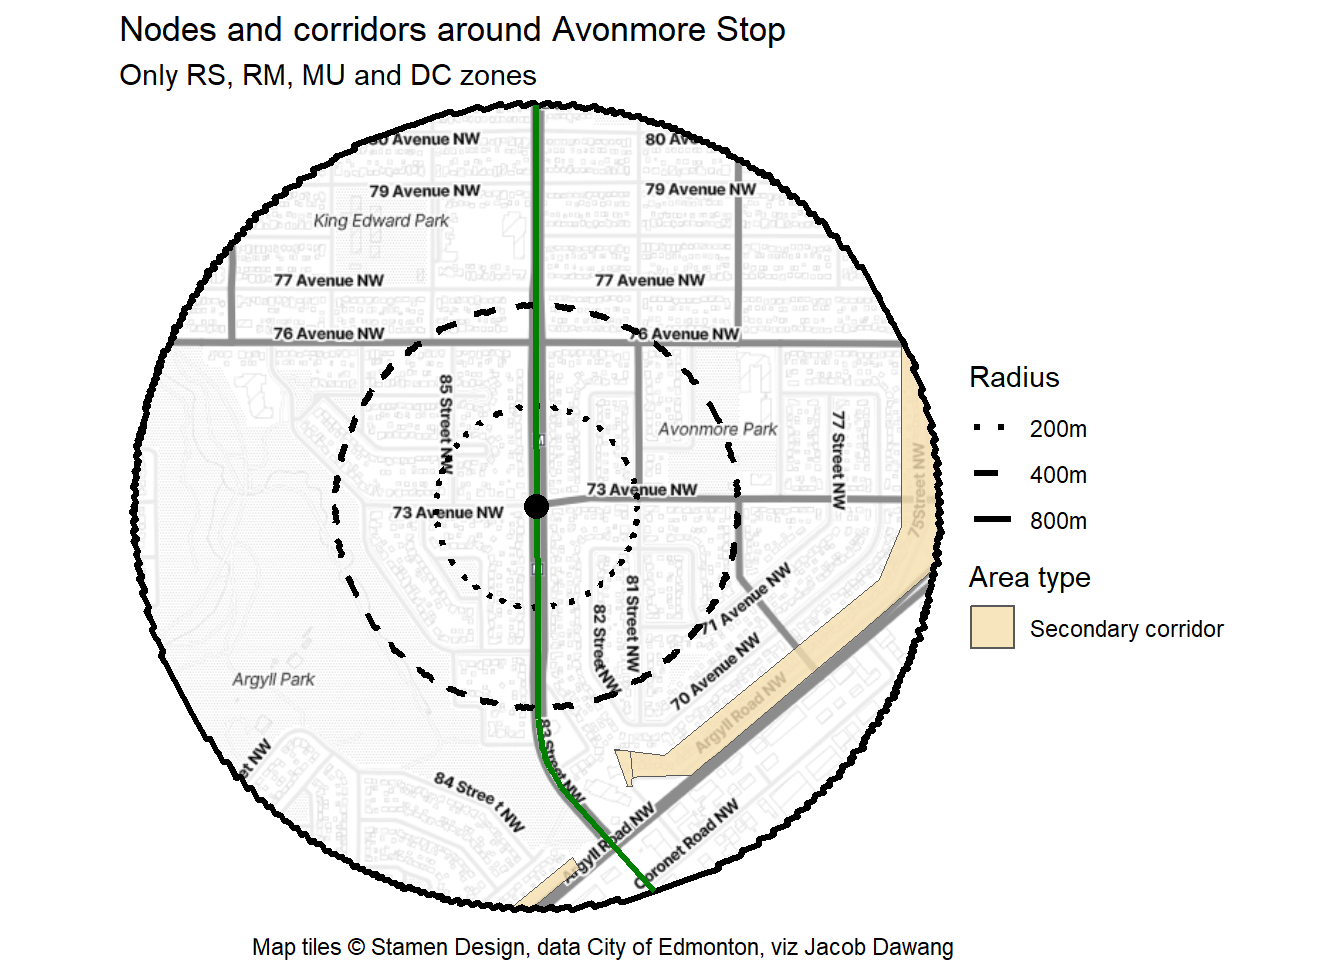
Now, using the zoning data, we can remove plots zoned for parks, fire halls and other jurisdictions, where housing is unlikely to be built, even through a rezoning. Figure 11 shows the coverage of nodes and corridors when we exclude these zones. While there was already low node and corridor coverage, using this map, only 4% of the station area is covered by the secondary corridors that will support up to 8 storeys.
Conclusion
I think it’s a significant missed opportunity that there are no policies to encourage higher-density development around rapid transit stations like Avonmore. Even worse than McKernan/Belgravia station, Avonmore stop is not even in a secondary corridor, making it likely that we will not see any additional density beyond the 8 units per lot allowed in the base RS zone.
The district plans are still being edited and will come back to Council in Q2 2024. If you agree that we need more transit-oriented development policies in the district plans, please email your councillor and sign up for the Grow Together Edmonton mailing list to stay up-to-date on Edmonton housing news.