On October 20, Edmonton elected a new council and mayor. As I wrote in the Edmonton Journal, pro-housing councillors were re-elected en-masse, despite the rhetoric about a change election. However, there are four new councillors elected in Wards Ipiihkoohkanipiaohtsi, Nakota Isga, pihêsiwin, and sipiwiyiniwak. Let’s take a look at infill in their wards, how much is being built – or not – and where. Because basically all of city council’s recent contentious votes surround the details of the RS zone (residential small scale), I will in turn focus the ward profiles on this zone, and especially the 7-8 unit rowhouses that are the most controversial. Also, this current council is definitely not going down below a 6 unit maximum, if at all, so the focus on 7-8 units is appropriate.
But first, here’s a RS zone primer.
The RS Zone
The RS zone permits a range of housing types, from a single-detached home with a backyard suite to a row house. The key regulations include a maximum building height of 10.5 metres (about three storeys), a maximum site coverage of 45%, and a minimum site area of 75 square metres per dwelling.
In July 2025, City Council passed significant amendments to the RS zone focused entirely on design, scale, and size of the permitted buildings. The most significant change was to building length. Previously, a building could be up to 30 metres long. The new, more restrictive rule states that for an interior lot, the maximum building length along an interior side lot line is now 50% of the site depth, or 25 metres, whichever is less. Other key design tweaks included limiting the total number of side-yard entrances to two and increasing the minimum side setback to 1.9 metres where a side entrance is located.
What did not pass was a proposed reduction in maximum number of units midblock from 8 to 6.
What does this mean in practice? If you’ve seen that photo from Crestwood (IYKYK), then that would not be allowed to be built any more. The buildings would have to be way shallower, and more set back from the side.
Data
Edmonton’s general building permit data has tracked building permits since 2009. It contains columns for building type, work type, location, units added, and more for each building permit.
Edmonton’s property assessment data contains one row per assessed property, along with their zoning. I use it as a comprehensive list of properties.
Edmonton’s zoning data contains spatial data for each zone.
LRT station locations.
Neighbourhood and ward boundaries.
Ward Ipiihkoohkanipiaohtsi
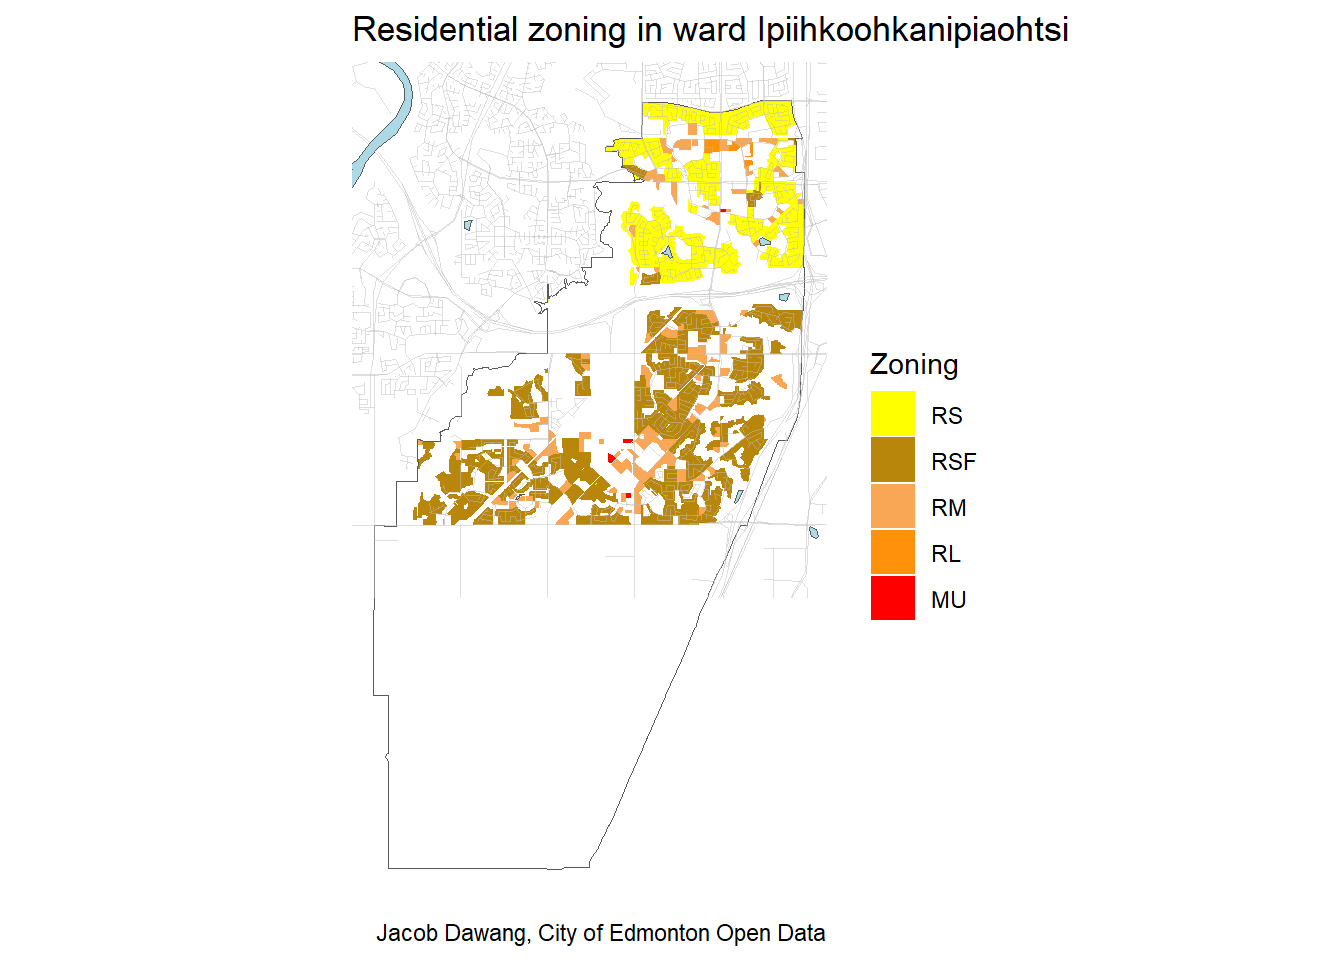
Let’s start down south. Jon Morgan was elected councillor, defeating incumbent Jennifer Rice. First, let’s take a look at just how much of his ward is zoned RS in Figure 1.
There is definitely some RS just north of the Henday, but most of his ward is zoned RSF, which has barely been debated at council and is way more permissive than the RS zone.
As we can see in Table 1, there is literally no 7-8plex activity happening in this ward at all. Not one has been permitted since ZBR came into effect in 2024.
| Number of 7-8plexes in ward Ipiihkoohkanipiaohtsi by neighbourhood | |||
| RS zone, January 1, 2024 to November 5, 2025 | |||
| Neighbourhood | Number of 7-8 unit permits in RS zone | Total number of properties zoned RS | % of properties redeveloped into 7-8plex |
|---|---|---|---|
| Anthony Henday South Blackburne | 0 | 1 | 0% |
| Bearspaw | 0 | 578 | 0% |
| Blue Quill | 0 | 522 | 0% |
| Blue Quill Estates | 0 | 205 | 0% |
| Ermineskin | 0 | 328 | 0% |
| Keheewin | 0 | 510 | 0% |
| Richford | 0 | 1 | 0% |
| Skyrattler | 0 | 194 | 0% |
| Steinhauer | 0 | 586 | 0% |
| Sweet Grass | 0 | 457 | 0% |
| Twin Brooks | 0 | 1781 | 0% |
| Allard | 0 | 0 | — |
| Anthony Henday South | 0 | 0 | — |
| Blackburne | 0 | 0 | — |
| Blackmud Creek | 0 | 0 | — |
| Blackmud Creek Ravine | 0 | 0 | — |
| Callaghan | 0 | 0 | — |
| Cashman | 0 | 0 | — |
| Cavanagh | 0 | 0 | — |
| Chappelle | 0 | 0 | — |
| Desrochers Area | 0 | 0 | — |
| Edmonton South Central | 0 | 0 | — |
| Glenridding Ravine | 0 | 0 | — |
| Graydon Hill | 0 | 0 | — |
| Hays Ridge Area | 0 | 0 | — |
| Heritage Valley Area | 0 | 0 | — |
| Heritage Valley Town Centre | 0 | 0 | — |
| Macewan | 0 | 0 | — |
| Paisley | 0 | 0 | — |
| Rutherford | 0 | 0 | — |
| Whitemud Creek Ravine Twin Brooks | 0 | 0 | — |
| Total - Ward | 0 | 5163 | 0% |
| Jacob Dawang, City of Edmonton Open Data | |||
Ward Nakota Isga
Next to Ward Nakota Isga. Reed Clarke won here, stepping into Andrew Knack’s old seat, who became mayor. This ward includes much of the Valley Line West LRT under construction and stands to benefit a lot from it.
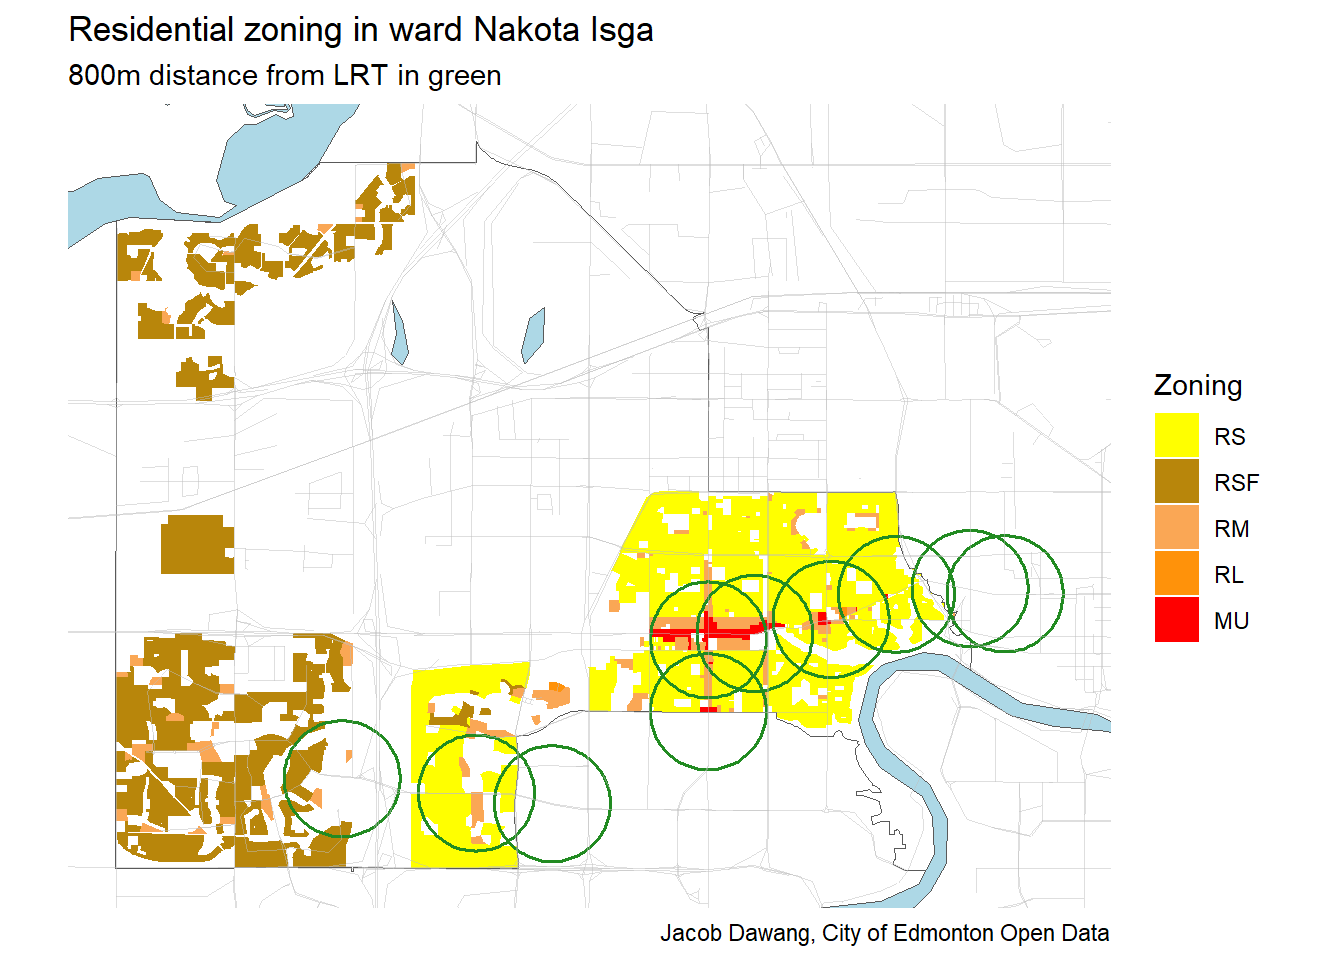
Figure 2 shows that a lot of the ward is zoned RS. But, also a huge proportion of the RS-zoned land is within 800m walking distance of LRT, as shown by the green circles in the image.
Nakota Isga is one of the wards seeing more building of 7-8plexes. Table 2 shows that Glenwood has seen the most 7-8plexes approved so far, with 24. However, when compared to the overall size of the housing stock, redevelopment in the RS zone is still not significant, with only 0.9% of properties zoned RS in the ward developed into 7-8plexes since 2024. At this pace, it would be decades before even a significant minority of homes are 7-8plexes.
As well, I have added population counts from the 1971 and 2021 censuses, as well as the percent change. These mature neighbourhoods in Ward Nakota Isga house less people – in some cases significantly less – from their design capacity. This decline in population is one of the main reasons why their infrastructure can handle more growth today. Making better use of the undercapacity sewers to alone saves the taxpayer so much money.
| Number of 7-8plexes in ward Nakota Isga by neighbourhood | ||||||
| RS zone, January 1, 2024 to November 5, 2025 | ||||||
| Neighbourhood | Number of 7-8 unit permits in RS zone | Total number of properties zoned RS | % of properties redeveloped into 7-8plex | Population 2021 | Population 1971 | % change in population |
|---|---|---|---|---|---|---|
| Glenwood | 24 | 993 | 2.42% | 4,960 | 5,650 | −12% |
| Britannia Youngstown | 18 | 895 | 2.01% | 4,350 | 4,590 | −5% |
| West Jasper Place | 10 | 569 | 1.76% | 2,885 | 2,925 | −1% |
| High Park | 10 | 619 | 1.62% | 1,480 | 2,545 | −42% |
| Canora | 9 | 637 | 1.41% | 3,640 | 3,515 | 4% |
| Grovenor | 13 | 943 | 1.38% | 2,585 | 3,100 | −17% |
| Glenora | 8 | 1,198 | 0.67% | 3,530 | 4,465 | −21% |
| North Glenora | 4 | 732 | 0.55% | 2,195 | 3,015 | −27% |
| Crestwood | 4 | 860 | 0.47% | 2,415 | 3,445 | −30% |
| Mayfield | 2 | 791 | 0.25% | 1,930 | 3,615 | −47% |
| Aldergrove | 0 | 1,122 | 0.00% | 5,260 | 0 | Inf% |
| Belmead | 0 | 832 | 0.00% | 4,615 | 0 | Inf% |
| La Perle | 0 | 752 | 0.00% | 5,025 | 0 | Inf% |
| Mcqueen | 0 | 433 | 0.00% | 1,475 | 2,515 | −41% |
| River Valley Glenora | 0 | 1 | 0.00% | — | — | — |
| Alberta Park Industrial | 0 | 0 | — | — | — | — |
| Anthony Henday | 0 | 0 | — | — | — | — |
| Anthony Henday Big Lake | 0 | 0 | — | — | — | — |
| Armstrong Industrial | 0 | 0 | — | — | — | — |
| Breckenridge Greens | 0 | 0 | — | 1,930 | 0 | Inf% |
| Carleton Square Industrial | 0 | 0 | — | — | — | — |
| Edmiston Industrial | 0 | 0 | — | — | — | — |
| Hawin Park Estate Industrial | 0 | 0 | — | — | — | — |
| Hawks Ridge | 0 | 0 | — | 970 | 0 | Inf% |
| Kinglet Gardens | 0 | 0 | — | 365 | 0 | Inf% |
| Kinokamau Plains Area | 0 | 0 | — | 0 | 0 | — |
| Lewis Farms Industrial | 0 | 0 | — | — | — | — |
| Mcnamara Industrial | 0 | 0 | — | — | — | — |
| Morin Industrial | 0 | 0 | — | — | — | — |
| Norwester Industrial | 0 | 0 | — | — | — | — |
| Pintail Landing | 0 | 0 | — | — | — | — |
| Place Larue | 0 | 0 | — | 0 | 0 | — |
| Potter Greens | 0 | 0 | — | 1,485 | 0 | Inf% |
| Poundmaker Industrial | 0 | 0 | — | — | — | — |
| River Valley Capitol Hill | 0 | 0 | — | 0 | 415 | −100% |
| Rosenthal | 0 | 0 | — | 4,840 | 0 | Inf% |
| Secord | 0 | 0 | — | 8,100 | 0 | Inf% |
| Sheffield Industrial | 0 | 0 | — | — | — | — |
| Starling | 0 | 0 | — | 2,045 | 0 | Inf% |
| Stewart Greens | 0 | 0 | — | 1,460 | 0 | Inf% |
| Stone Industrial | 0 | 0 | — | — | — | — |
| Suder Greens | 0 | 0 | — | 3,385 | 0 | Inf% |
| Sunwapta Industrial | 0 | 0 | — | — | — | — |
| Terra Losa | 0 | 0 | — | 1,985 | 0 | Inf% |
| Trumpeter Area | 0 | 0 | — | 2,035 | 0 | Inf% |
| Webber Greens | 0 | 0 | — | 3,005 | 0 | Inf% |
| West Sheffield Industrial | 0 | 0 | — | — | — | — |
| Westview Village | 0 | 0 | — | 1,930 | 0 | Inf% |
| White Industrial | 0 | 0 | — | — | — | — |
| Wilson Industrial | 0 | 0 | — | — | — | — |
| Winterburn Industrial Area East | 0 | 0 | — | — | — | — |
| Winterburn Industrial Area West | 0 | 0 | — | — | — | — |
| Youngstown Industrial | 0 | 0 | — | — | — | — |
| Total - Ward | 102 | 11,377 | 0.90% | 79,880 | 39,795 | 101% |
| Jacob Dawang, City of Edmonton Open Data, StatCan census | ||||||
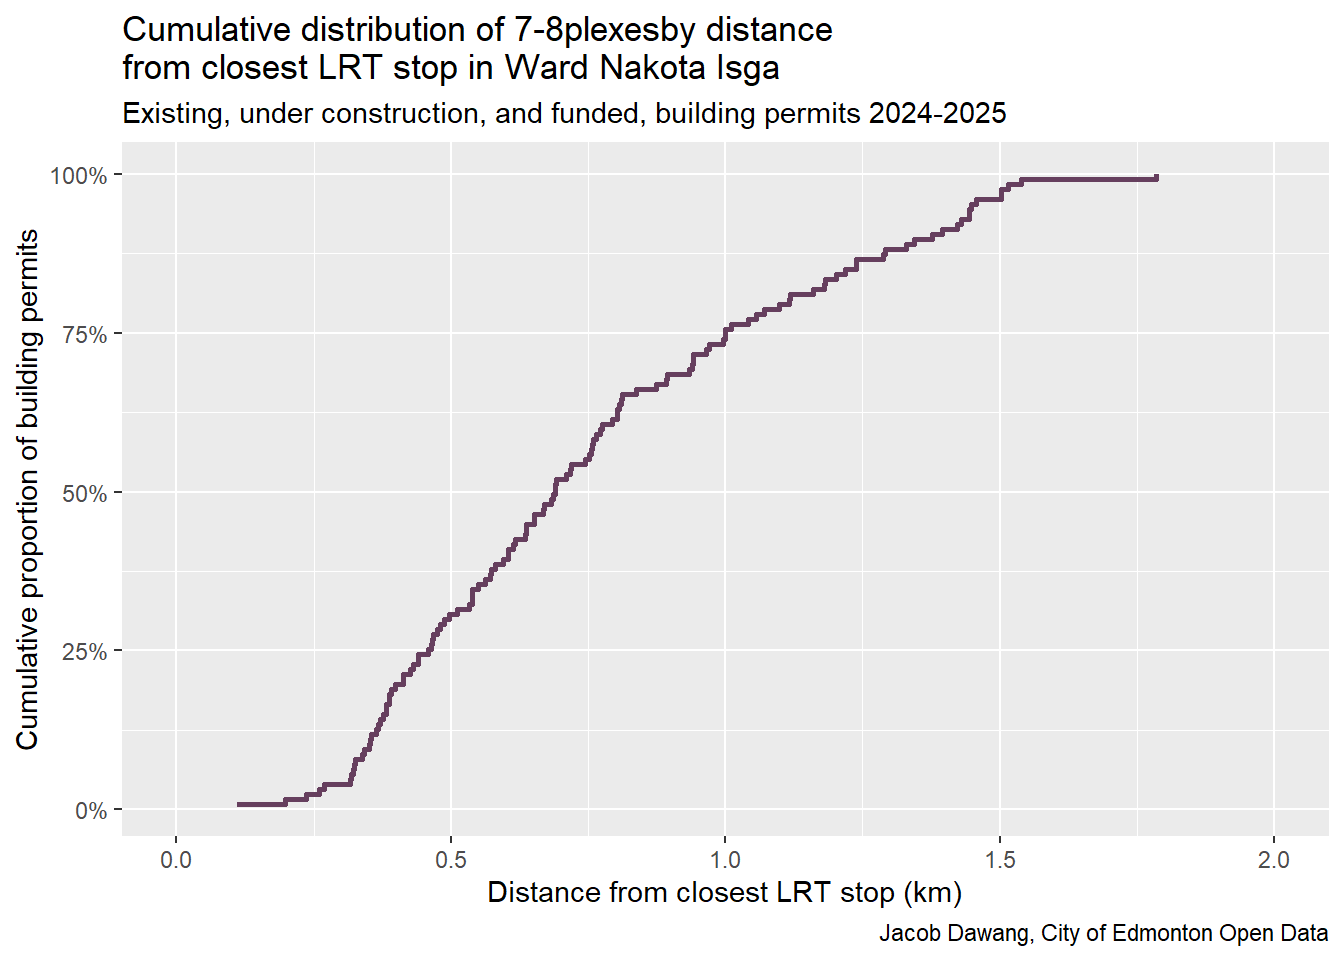
It’s impossible to talk about infill in Ward Nakota Isga without talking about the Valley Line West LRT. Figure 3 shows a clear relation between the path of the LRT and where 7-8plexes are being built.
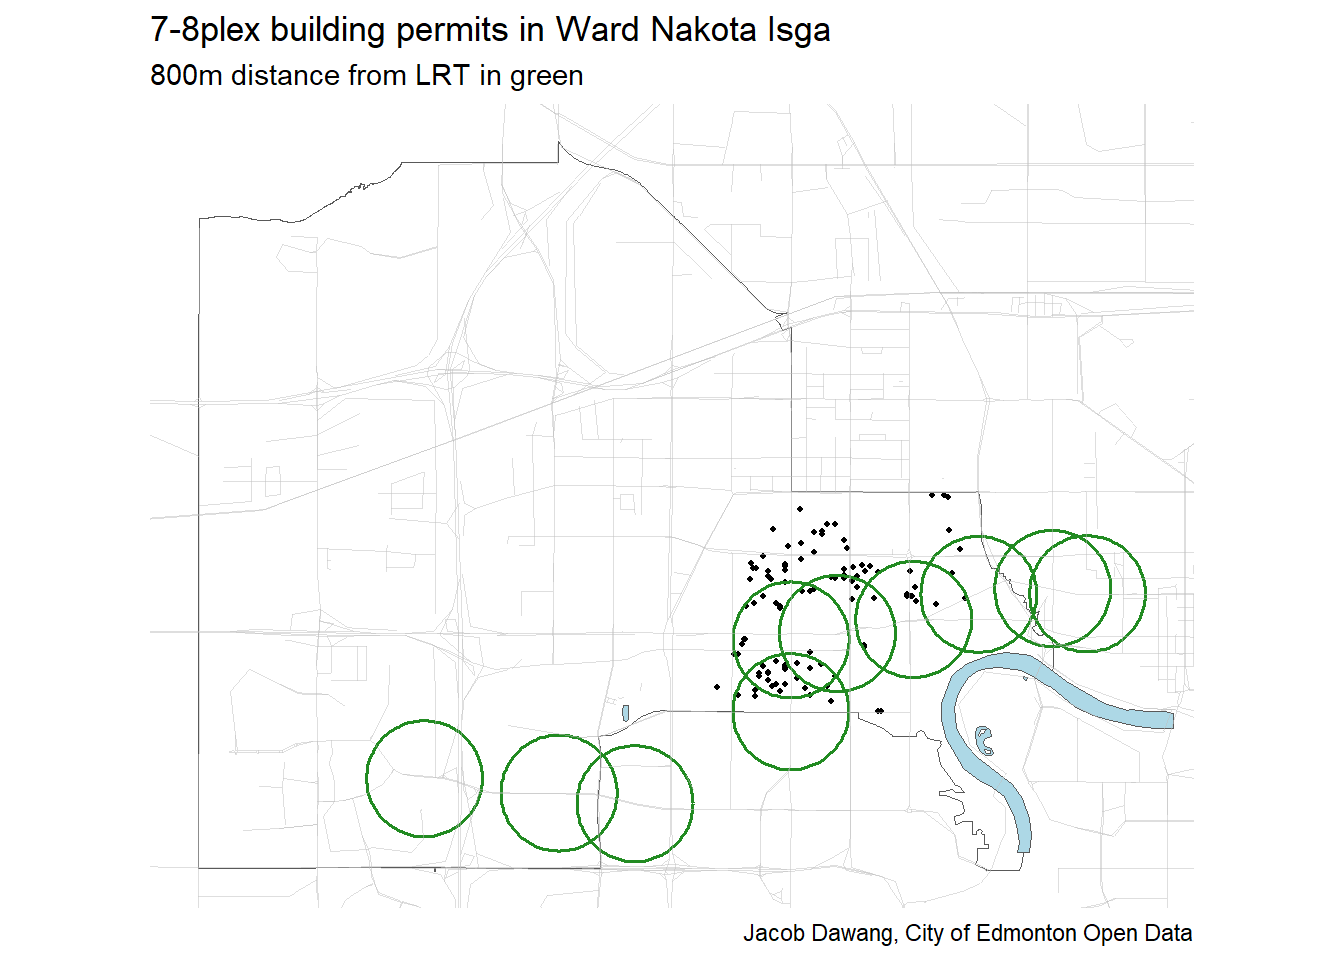
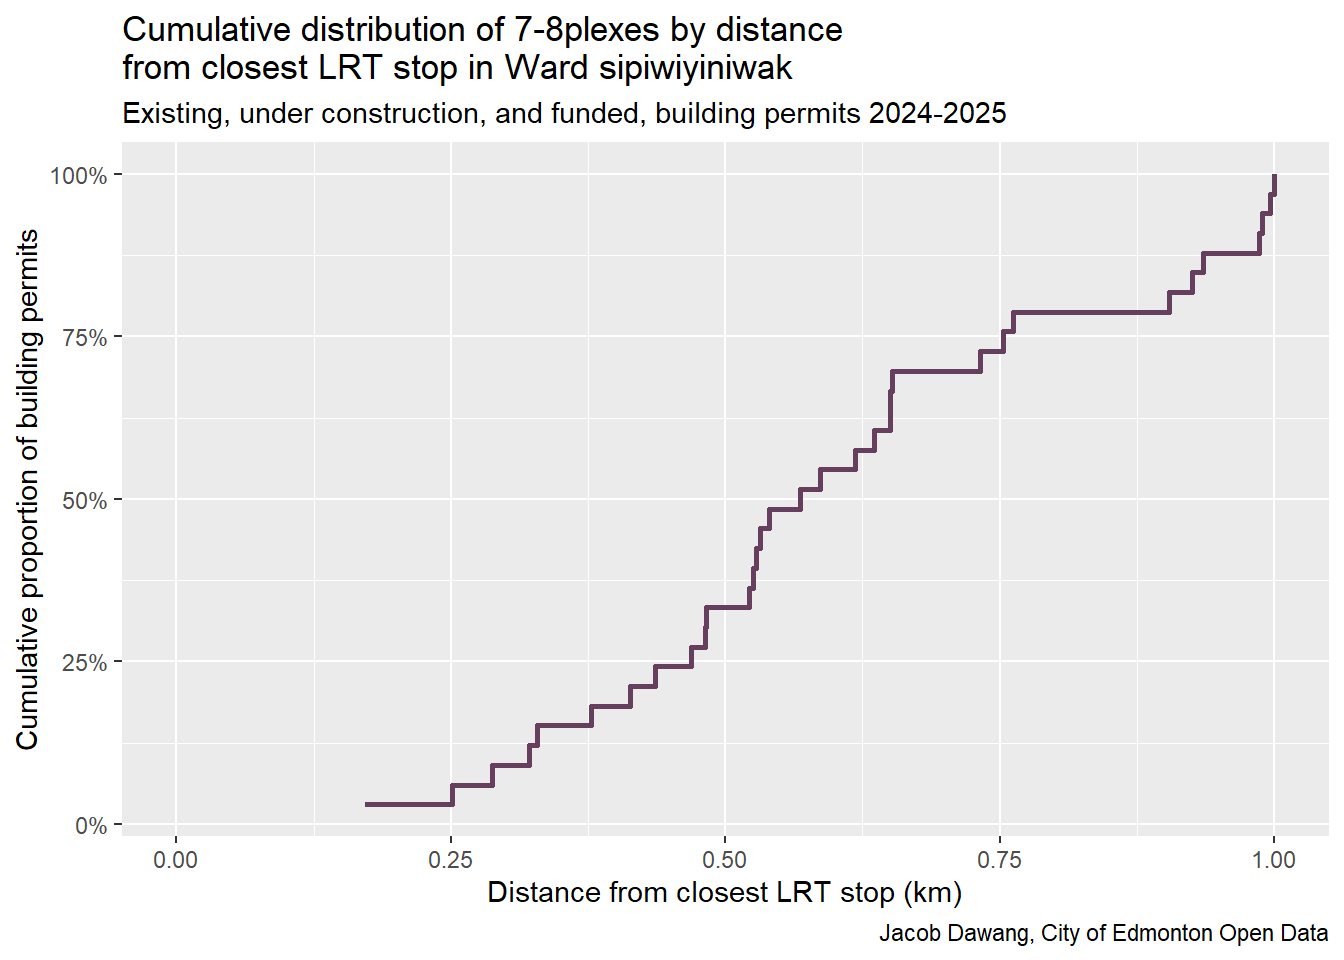
To quantify distance from LRT, let’s look at the cumulative distribution of 7-8plexes by distance from LRT. Figure 4 confirms that 7-8plexes are essentially following the Valley Line West. 75% are built within 1km of a LRT stop, 50% are less than 750m away.
Ward pihêsiwin
On to Ward pihêsiwin where Mike Elliott won, filling Tim Cartmell’s old seat.
In Figure 5, we see that the northern part of the ward is zoned RS, whereas the southern part is zoned for the more flexible RSF.
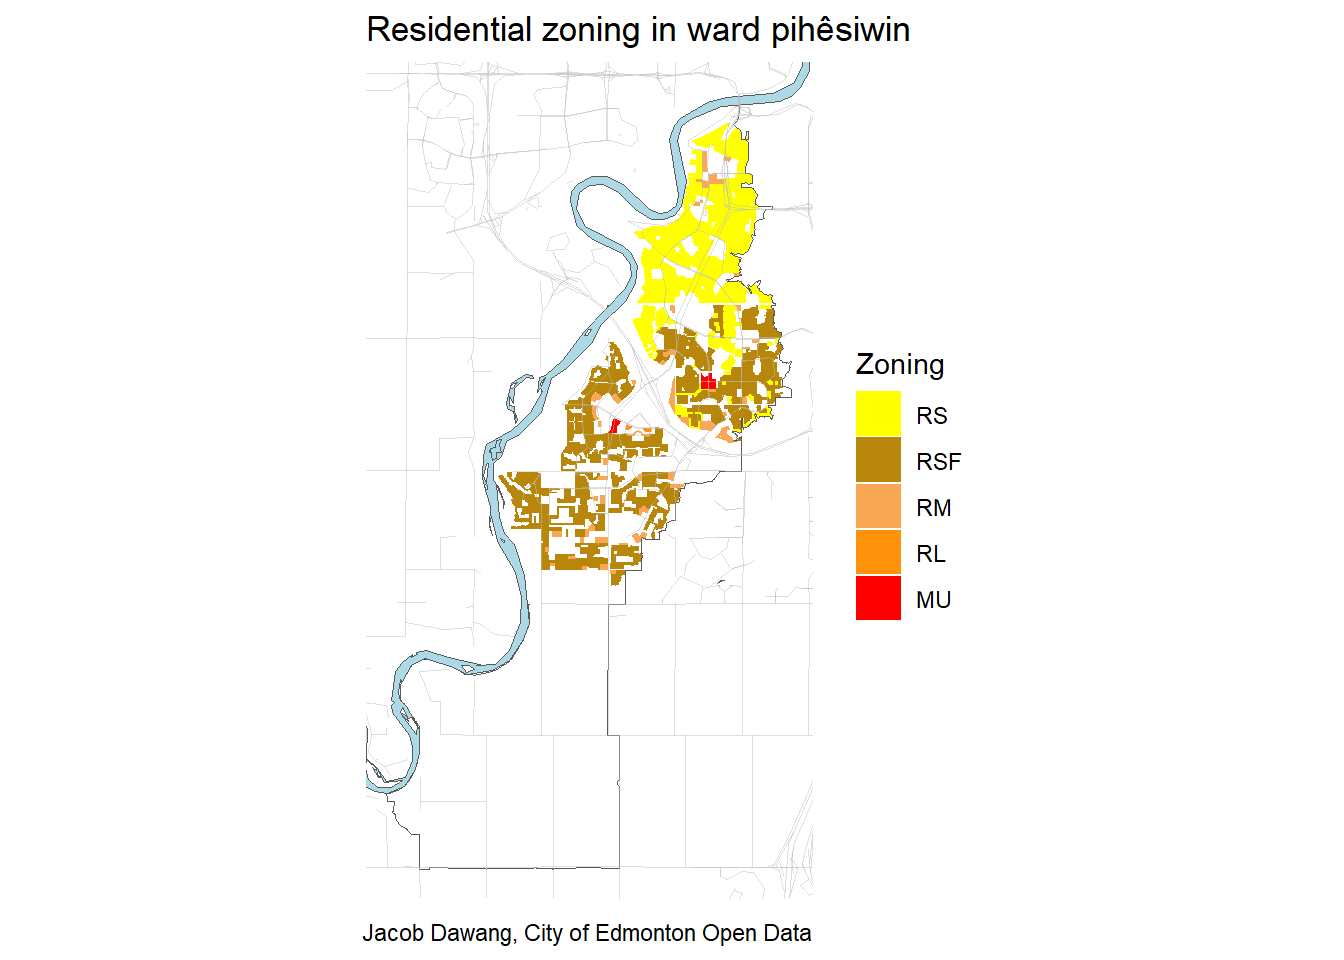
Just like Ward Ipiihkoohkanipiaohtsi, there has been literally zero 7-8plexes approved in the RS zone in pihêsiwin. Infill of the form that has some people up in arms is simply not happening at all in this ward.
| Number of 7-8plexes in ward pihêsiwin by neighbourhood | ||||||
| RS zone, January 1, 2024 to November 5, 2025 | ||||||
| Neighbourhood | Number of 7-8 unit permits in RS zone | Total number of properties zoned RS | % of properties redeveloped into 7-8plex | Population 2021 | Population 1971 | % change in population |
|---|---|---|---|---|---|---|
| Brander Gardens | 0 | 312 | 0.00% | 2,435 | 0 | Inf% |
| Brookside | 0 | 595 | 0.00% | 1,980 | 1,895 | 4% |
| Bulyea Heights | 0 | 1,076 | 0.00% | 3,610 | 0 | Inf% |
| Carter Crest | 0 | 444 | 0.00% | 1,515 | 0 | Inf% |
| Falconer Heights | 0 | 458 | 0.00% | 1,670 | 0 | Inf% |
| Haddow | 0 | 720 | 0.00% | 4,335 | 0 | Inf% |
| Henderson Estates | 0 | 574 | 0.00% | 1,595 | 0 | Inf% |
| Hodgson | 0 | 34 | 0.00% | 2,625 | 0 | Inf% |
| Leger | 0 | 441 | 0.00% | 2,585 | 0 | Inf% |
| Mactaggart | 0 | 96 | 0.00% | 3,325 | 0 | Inf% |
| Magrath Heights | 0 | 47 | 0.00% | 3,945 | 0 | Inf% |
| Ogilvie Ridge | 0 | 308 | 0.00% | 930 | 0 | Inf% |
| Ramsay Heights | 0 | 763 | 0.00% | 3,250 | 0 | Inf% |
| Rhatigan Ridge | 0 | 1,093 | 0.00% | 3,125 | 0 | Inf% |
| River Valley Fort Edmonton | 0 | 1 | 0.00% | — | — | — |
| River Valley Terwillegar | 0 | 1 | 0.00% | — | — | — |
| South Terwillegar | 0 | 391 | 0.00% | 9,460 | 0 | Inf% |
| Terwillegar Towne | 0 | 330 | 0.00% | 6,060 | 0 | Inf% |
| Ambleside | 0 | 0 | — | 6,730 | 375 | 1,695% |
| Anthony Henday Terwillegar | 0 | 0 | — | — | — | — |
| Chappelle | 0 | 0 | — | — | — | — |
| Edmonton South West | 0 | 0 | — | — | — | — |
| Glenridding Heights | 0 | 0 | — | 4,340 | 0 | Inf% |
| Glenridding Ravine | 0 | 0 | — | — | — | — |
| Keswick | 0 | 0 | — | — | — | — |
| River Valley Windermere | 0 | 0 | — | — | — | — |
| Windermere | 0 | 0 | — | 12,975 | 0 | Inf% |
| Windermere Area | 0 | 0 | — | 0 | 0 | — |
| Total - Ward | 0 | 7,684 | 0.00% | 76,490 | 2,270 | 3,270% |
| Jacob Dawang, City of Edmonton Open Data, StatCan census | ||||||
Ward sipiwiyiniwak
Lastly, Ward sipiwiyiniwak. Thu Parmar steps in for Sarah Hamilton, who elected not to run again.
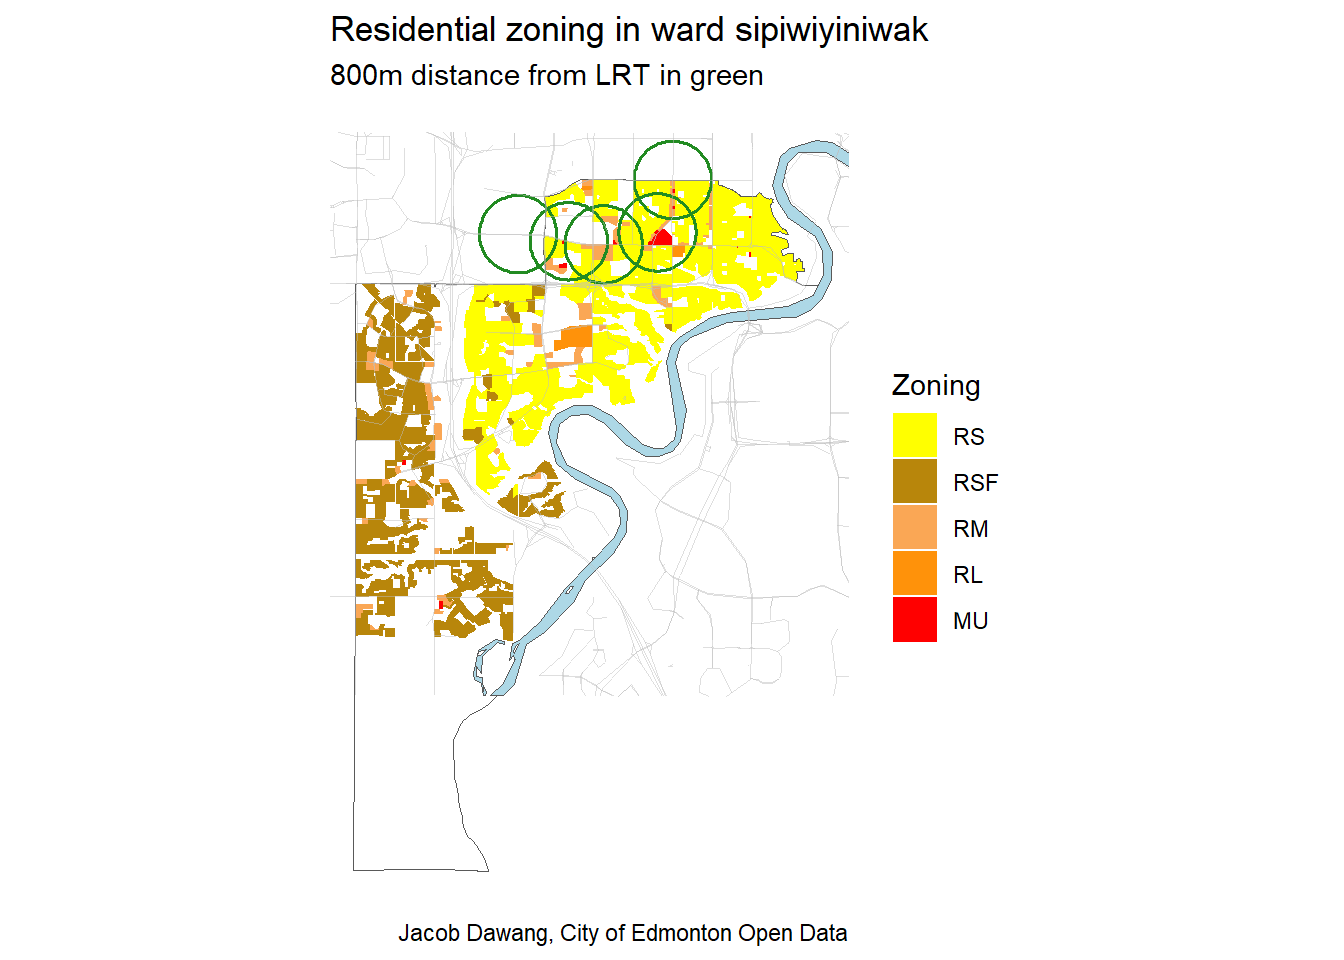
Figure 6 shows that the ward is a mix of RS in the northeast and the more flexible RSF in the southwest. The Valley Line West cuts across the northernmost part of the ward.
Ward sipiwiyiniwak is seeing a little bit of infill in the RS zone. Table 4 shows that Sherwood and Jasper Park have the most 7-8plexes, but it quickly drops off from there, with most neighbourhoods not having any 7-8plex infill in the past two years since ZBR. As a whole, only 27 of over 14,000 properties have been redeveloped into a 7-8plex.
| Number of 7-8plexes in ward sipiwiyiniwak by neighbourhood | ||||||
| RS zone, January 1, 2024 to November 5, 2025 | ||||||
| Neighbourhood | Number of 7-8 unit permits in RS zone | Total number of properties zoned RS | % of properties redeveloped into 7-8plex | Population 2021 | Population 1971 | % change in population |
|---|---|---|---|---|---|---|
| Sherwood | 13 | 388 | 3.35% | 1,190 | 1,470 | −19% |
| Jasper Park | 11 | 480 | 2.29% | 2,040 | 2,240 | −9% |
| Elmwood | 2 | 743 | 0.27% | 2,705 | 4,775 | −43% |
| West Meadowlark Park | 1 | 564 | 0.18% | 2,885 | 4,070 | −29% |
| Callingwood North | 0 | 131 | 0.00% | 2,340 | 0 | Inf% |
| Cameron Heights | 0 | 36 | 0.00% | 2,220 | 0 | Inf% |
| Dechene | 0 | 512 | 0.00% | 1,520 | 0 | Inf% |
| Donsdale | 0 | 393 | 0.00% | 1,205 | 0 | Inf% |
| Gariepy | 0 | 521 | 0.00% | 1,800 | 0 | Inf% |
| Jamieson Place | 0 | 911 | 0.00% | 3,855 | 0 | Inf% |
| Laurier Heights | 0 | 977 | 0.00% | 2,575 | 4,250 | −39% |
| Lymburn | 0 | 1,129 | 0.00% | 5,795 | 0 | Inf% |
| Lynnwood | 0 | 780 | 0.00% | 3,220 | 3,080 | 5% |
| Meadowlark Park | 0 | 919 | 0.00% | 2,695 | 3,955 | −32% |
| Oleskiw | 0 | 925 | 0.00% | 2,915 | 0 | Inf% |
| Ormsby Place | 0 | 1,043 | 0.00% | 5,035 | 0 | Inf% |
| Parkview | 0 | 1,391 | 0.00% | 3,375 | 5,735 | −41% |
| Patricia Heights | 0 | 305 | 0.00% | 1,805 | 1,120 | 61% |
| Quesnell Heights | 0 | 125 | 0.00% | 325 | 325 | 0% |
| Rio Terrace | 0 | 509 | 0.00% | 1,240 | 1,925 | −36% |
| River Valley Lessard North | 0 | 2 | 0.00% | 0 | 450 | −100% |
| Summerlea | 0 | 303 | 0.00% | 1,925 | 250 | 670% |
| Thorncliff | 0 | 445 | 0.00% | 3,545 | 610 | 481% |
| Wedgewood Heights | 0 | 501 | 0.00% | 1,500 | 0 | Inf% |
| Westridge | 0 | 474 | 0.00% | 1,365 | 0 | Inf% |
| Anthony Henday South West | 0 | 0 | — | — | — | — |
| Callingwood South | 0 | 0 | — | 5,505 | 0 | Inf% |
| Edgemont | 0 | 0 | — | 5,050 | 0 | Inf% |
| Glastonbury | 0 | 0 | — | 6,260 | 520 | 1,104% |
| Granville | 0 | 0 | — | 3,040 | 0 | Inf% |
| River Valley Cameron | 0 | 0 | — | — | — | — |
| River Valley Laurier | 0 | 0 | — | — | — | — |
| River Valley Oleskiw | 0 | 0 | — | — | — | — |
| River's Edge | 0 | 0 | — | 0 | 0 | — |
| Riverview Area | 0 | 0 | — | 485 | 0 | Inf% |
| Stillwater | 0 | 0 | — | 925 | 0 | Inf% |
| The Hamptons | 0 | 0 | — | 12,800 | 0 | Inf% |
| The Uplands | 0 | 0 | — | — | — | — |
| Total - Ward | 27 | 14,507 | 0.19% | 93,140 | 34,775 | 168% |
| Jacob Dawang, City of Edmonton Open Data, StatCan census | ||||||
Where are 7-8plexes being built? Figure 7 shows that they are basically all within 800m of the Valley Line West LRT: true transit-oriented housing.
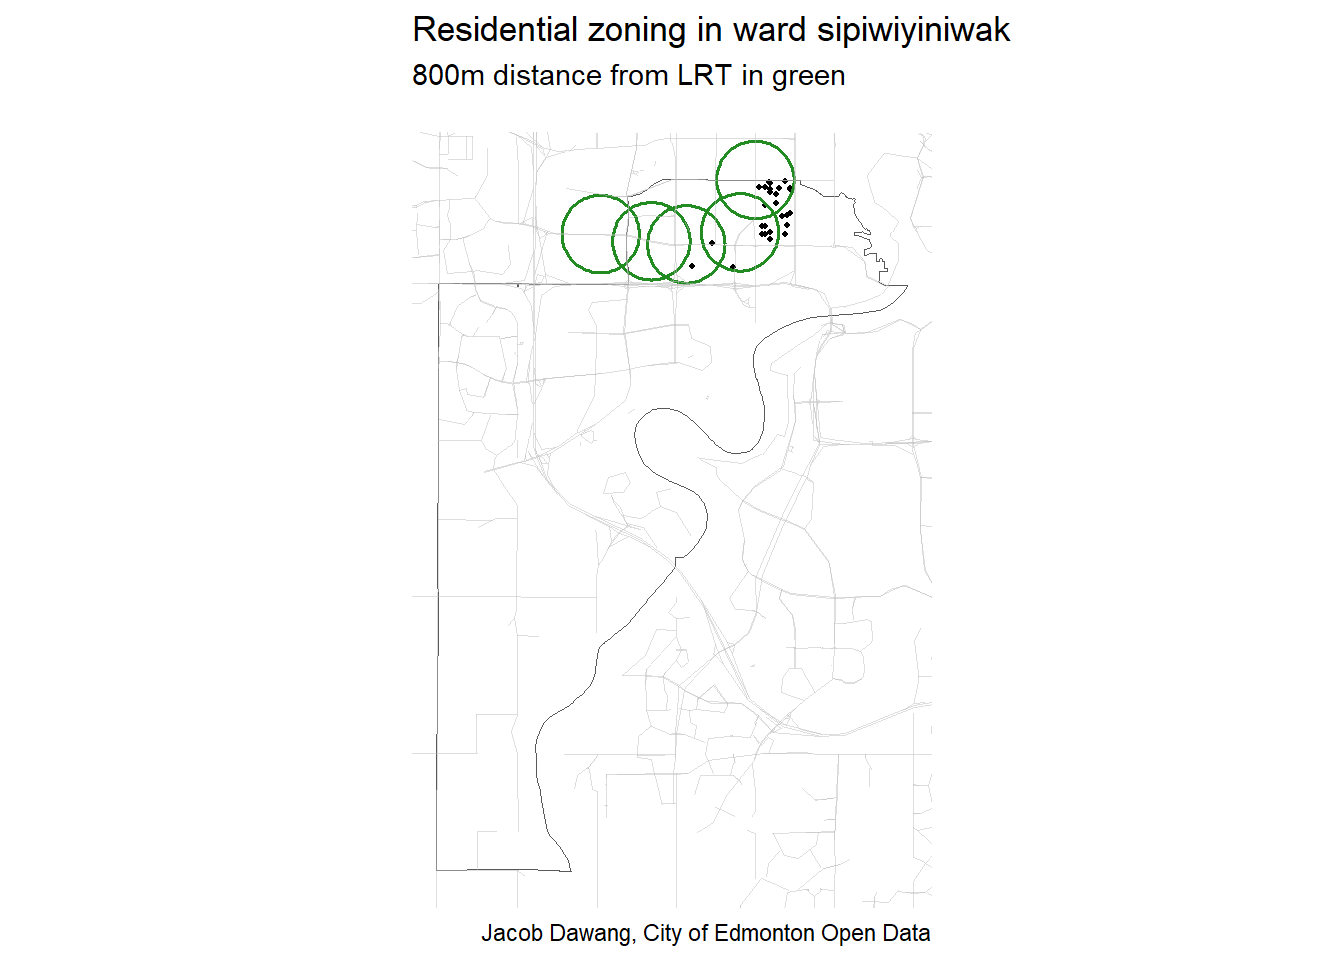
The cumulative distribution plot in Figure 8 confirms that 7-8plexes are built close to LRT, even more than in Ward Nakota Isga. 75% are within 750m and 100% have been built within 1km.