Infill is a more fiscally sustainable way to grow a city than greenfield expansion, on both sides of the ledger. On the revenue side, when a single-detached home in a mature neighbourhood becomes a 5+ unit rowhome or a 2 to 4 unit plex, or gains a backyard home, its assessed value multiplies, expanding the City’s property tax base.
On the cost side, infill reuses roads, sewers, and transit the City already owns instead of building more. That’s especially valuable in the mature neighbourhoods of Canada’s largest cities, Edmonton included, where populations have fallen by as much as 30% from their peak, leaving that infrastructure with room to spare. On the rare lot where the existing infrastructure can’t absorb the added demand, the upgrade is paid for by the developer, not the City. Every new road or pipe laid for a greenfield subdivision, by contrast, is a liability the City and its taxpayers will pay to maintain and renew.
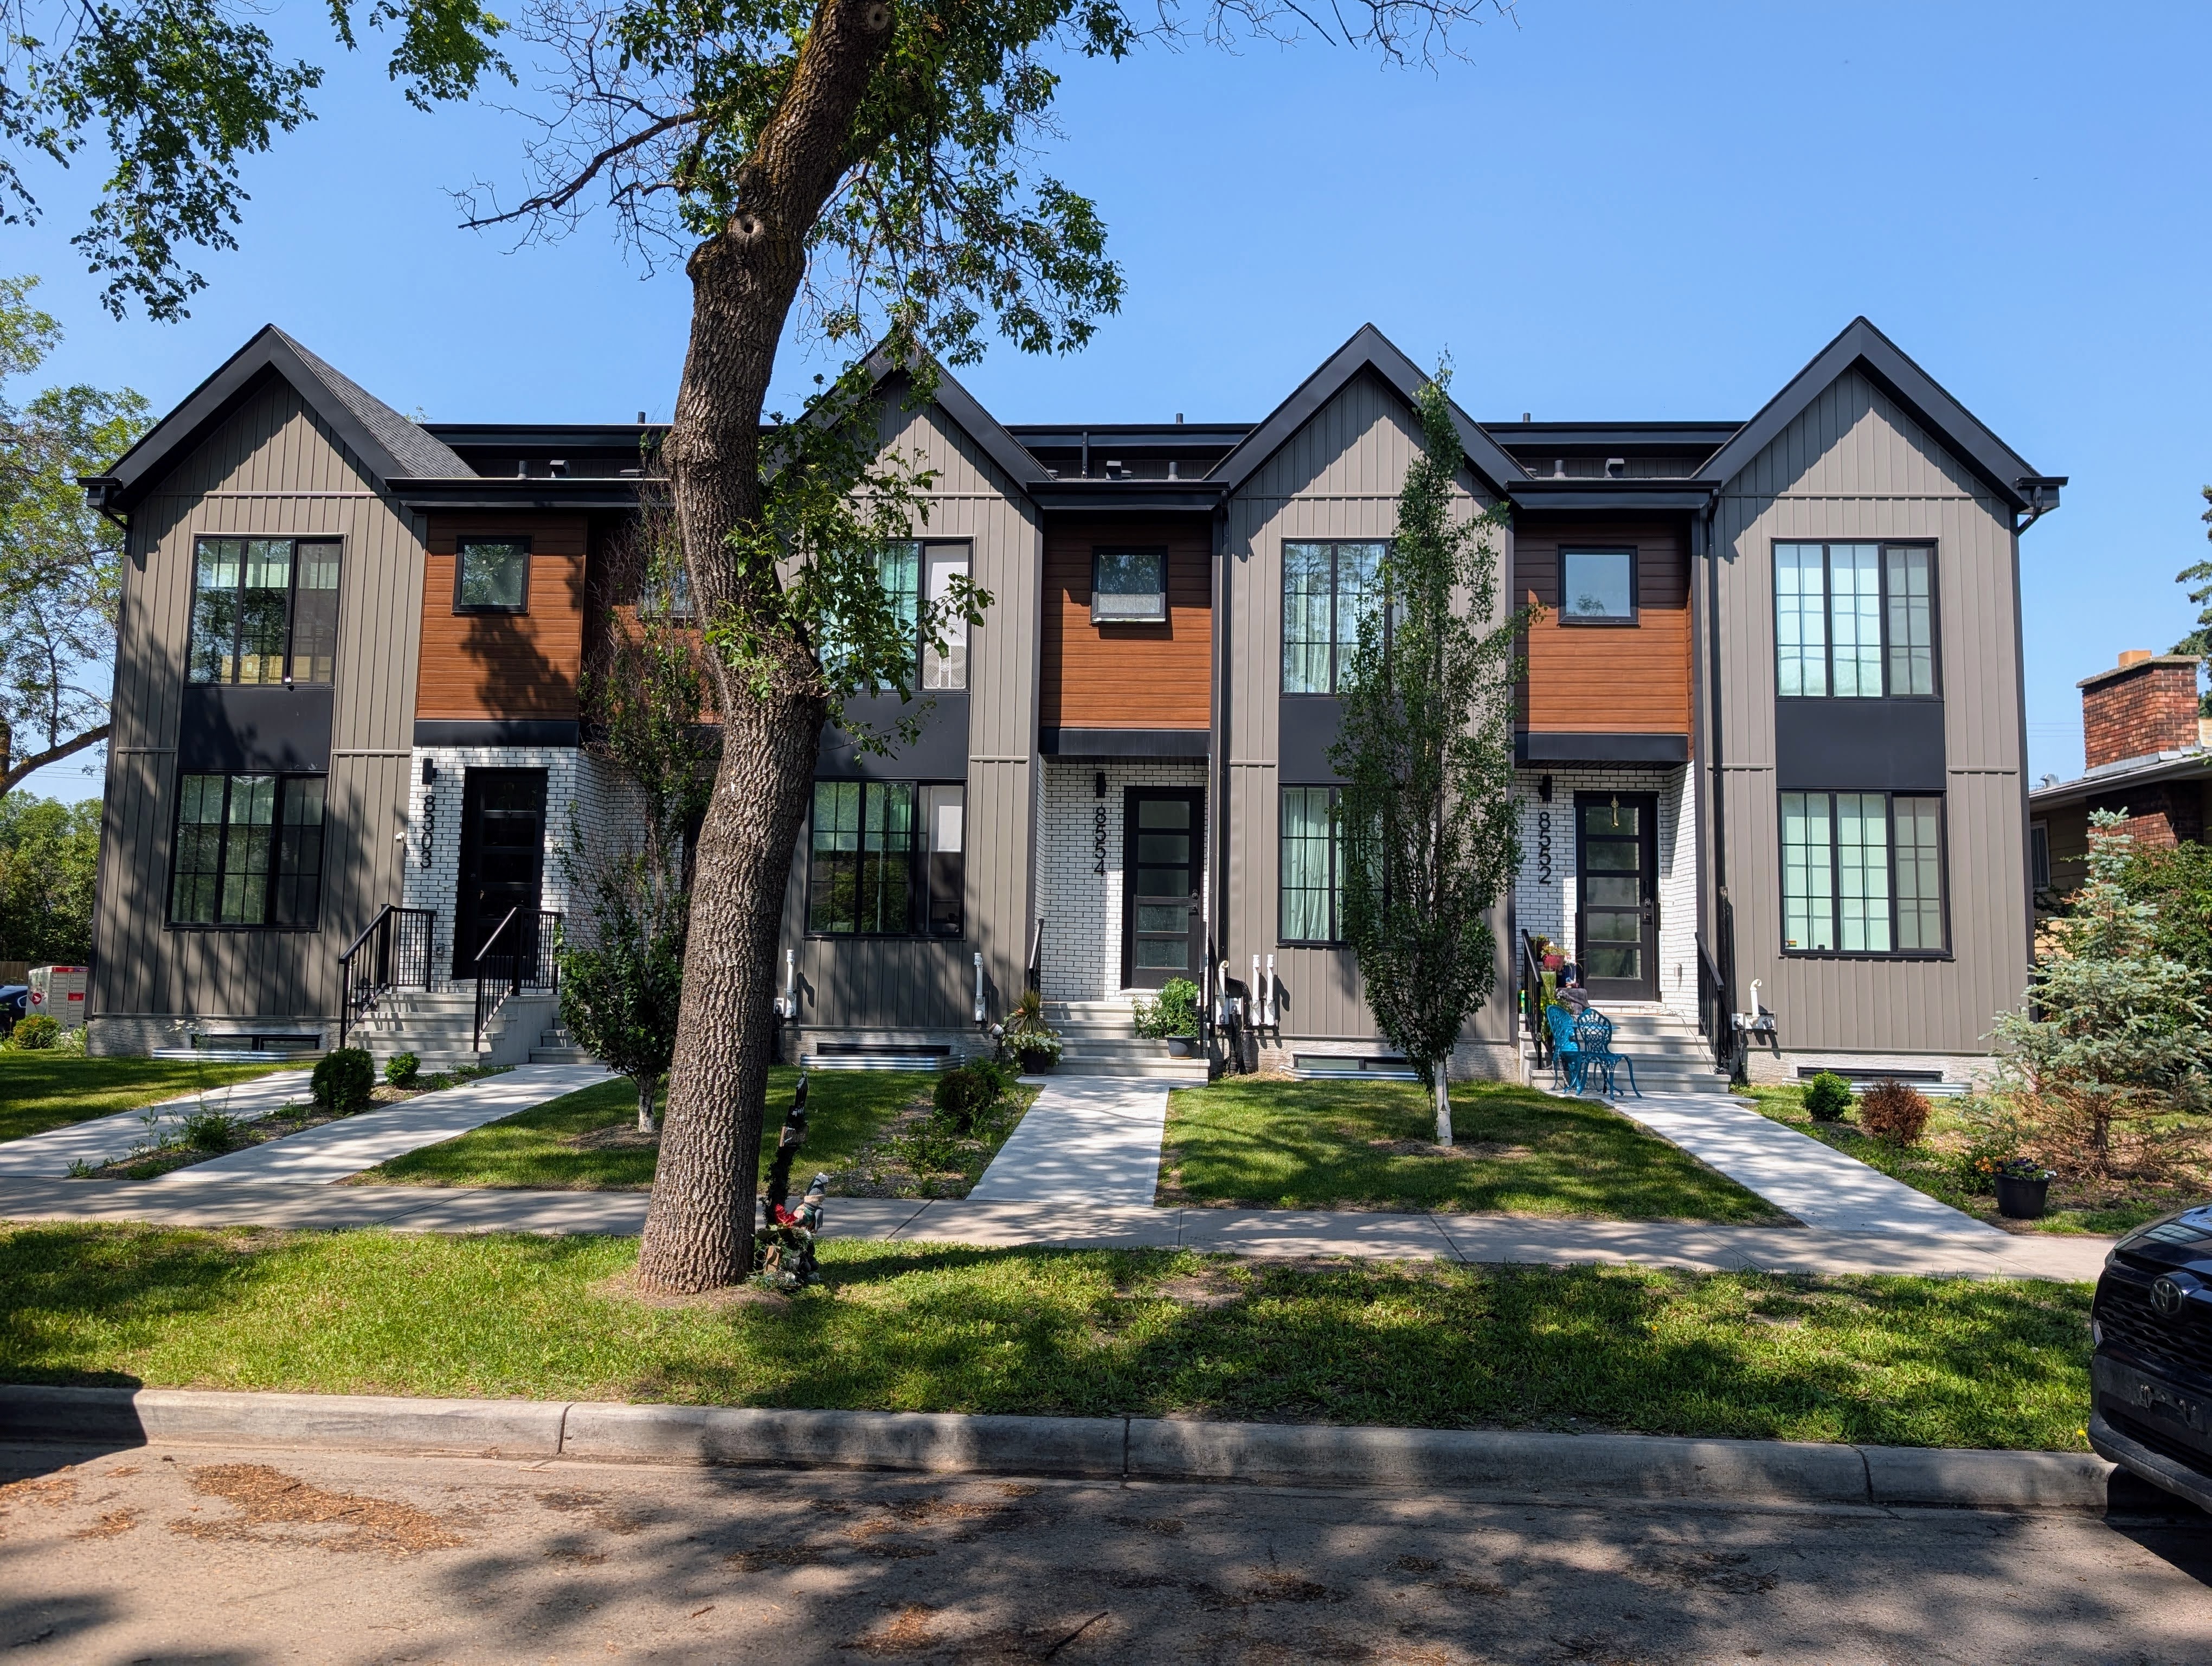
For two and a half years now, Edmonton’s Zoning Bylaw Renewal (ZBR) has been adding homes to existing neighbourhoods, mostly through three kinds of small-scale infill the RS Zone allows: the hugely popular 5+ unit rowhome (8 units is by far the most common size, though corner lots can go higher), the smaller 2 to 4 unit plex, and the backyard home (garden suite) added behind a retained house. In an ongoing series of blog posts, I track how the RS Zone is slowly transforming our city. This post asks a different question: what is all that redevelopment worth to the City’s property tax base — and, in turn, its property tax revenue and rate?
To measure it, I match 2024 building permits — the first year the RS Zone was in force — against the City’s property assessment data, then compute the uplift directly for completed projects in each category. I fit a single pooled model across all three to estimate what the full 2024–2026 pipeline adds up to. The 5+ unit rowhome is by far the largest category, so it gets the detailed worked example; I apply the same method to the other two.
Key numbers
$1.82 billion: The amount that small-scale infill — 5+ unit rowhomes, 2 to 4 unit plexes, and backyard homes — in the RS Zone from 2024–2026 will add to the property tax base at steady state (once every 2024–2026 permit is built and a future assessment fully reflects it).
$14.9 million per year: The incremental property tax the City of Edmonton will collect from RS Zone small-scale infill at steady state, if the tax rate stays where it is. Equivalently, Council could hold revenue flat and cut the property tax rate by 0.7% instead.
Data
This analysis combines four of Edmonton’s Open Data sources. Edmonton’s general building permit data, the same source used in the Q2 2026 building permit report, identifies which properties were redeveloped into 5+ unit rowhomes, 2 to 4 unit plexes, or backyard homes, and when. Edmonton’s current calendar year property assessment data gives each property’s assessed value as of 2026, and Edmonton’s historical property assessment data gives assessed values back to 2012, including 2024 and 2025. Edmonton’s property and education tax rate data supplies the municipal mill rates behind every tax figure in this post.
The unit of analysis throughout this post is the lot, not the permit — a redevelopment can take more than one permit, and a permit alone can double-count or miss a lot’s true uplift. Three situations come up:
- One permit on a lot. The common case: match the permit to that lot’s one pre- and post-redevelopment assessment.
- More than one permit on the same lot. A fourplex redevelopment plus a separate garden-suite permit on the same never-subdivided lot, for instance — sometimes issued a year or more apart. These are one redevelopment, not two, so I add the permits together: their units sum, and the one shared assessed value covers both (a garden suite is almost always assessed as part of its host property, not as a separate account). Categorizing by the combined unit count, not any single permit’s own count, means a fourplex-plus-suite lot with 6 total homes counts as part of the 5+ unit rowhome story, not the 2 to 4 unit plex one.
- A lot split into two or more child lots, each separately permitted — a duplex-style subdivision under a brand-new plan, for instance. Each child gets its own completed-building assessment, but only one of them, if any, can be traced back to the original, pre-split lot’s baseline value. I assign an equal share of that original value to each child as its baseline.
Matching permits to assessments and consolidating lots
The key challenge is linking a specific building permit to the same physical property, before and after redevelopment.
Matching a permit to its assessment record
I match on legal description (plan/block/lot) first — the most stable identifier across redevelopment — then fall back through two more tiers for the permits it misses. A building permit’s legal description looks like Plan 715HW Blk 25 Lot 22; the historical assessment records the same parcel as Plan: 715HW Block: 25 Lot: 22, so I parse both into a (plan, block, lot) key and join.
That legal-key match links most properties to their 2024 baseline assessed value directly. The first fallback is geographic: the nearest 2024 assessment point within 25m, for lots consolidated from two legal titles into one, or where the legal description format doesn’t parse identically on both sides.
The 25m fallback closes most of the remaining gap. What’s left mostly carries a legal description reissued under a brand-new subdivision plan, with no permit coordinates either — but the civic address usually still resolves, since Edmonton’s assessment rolls index every parcel by house number and street name independently of its legal description.
Combining all three tiers links 1409 of 1492 permits (94%) to a 2024 baseline assessed value directly. Some of the rest still turn out to have a baseline after all: Section 3.2 covers how.
In most cases the account number persists through redevelopment, so I use it to look up the completed building’s 2026 assessed value, with the same two fallbacks (25m geographic proximity, then civic address) for the properties issued a brand new account number when redeveloped.
That gives 1451 of 1492 permits (97%) a completed 2026 assessed value, whether or not that same permit matched a 2024 baseline directly.
Consolidating same-lot permits and lot splits
Every permit above is matched on its own, but the unit of analysis is the lot. I now collapse same-lot permits together (situation 2 from Section 2) and share a baseline across split lots (situation 3), spanning the full 2024–2026 timeframe: a fourplex permitted in 2024 and its garden suite permitted in 2025, for example, are still one lot, and treating them as two separate, single-year events would let the same original assessed value get counted twice.
Consolidating collapses 1492 permits into 1242 distinct lots. Sharing a baseline across split lots (situation 3) resolves 58 of them that the permit-level matchers above couldn’t reach on their own. Altogether, 1182 lots (95%) end up with both a 2024 baseline and a 2026 completed value.
The match rate is fairly even across all three categories: 97% of 5+ unit rowhome lots, 89% of 2 to 4 unit plex lots, and 97% of backyard-home lots resolve both a baseline and a completed value. Plexes are the category most likely to involve a lot split (a duplex-style subdivision into two semi-detached halves is a common way to build one), which is exactly the situation the split-baseline sharing above is for.
Measuring the uplift: the 2024 cohort
I measure completed 2024 lots in all three categories — 5+ unit rowhomes, 2 to 4 unit plexes, and backyard homes — using the same assessment-lag and counterfactual-growth machinery.
Worked example: the 5+ unit rowhome cohort
The 2026 property assessment is supposed to reflect each property’s physical condition as of December 31, 2025. In principle, that means any 2024-permitted lot whose building had received occupancy by the end of 2025 should be assessed as completed in the 2026 assessment roll. In practice, the assessments lag, as Section 4.1.1 checks directly.
Edmonton permitted 164 mature-neighbourhood RS Zone 5+ unit new-build lots in 2024, of which 109 had received occupancy by the end of 2025. 162 of the 164 (99%) match both a 2024 baseline and a 2026 assessed value; I use the occupancy dates to decide which of those the 2026 assessment actually reflects as complete.
When does the assessment catch up?
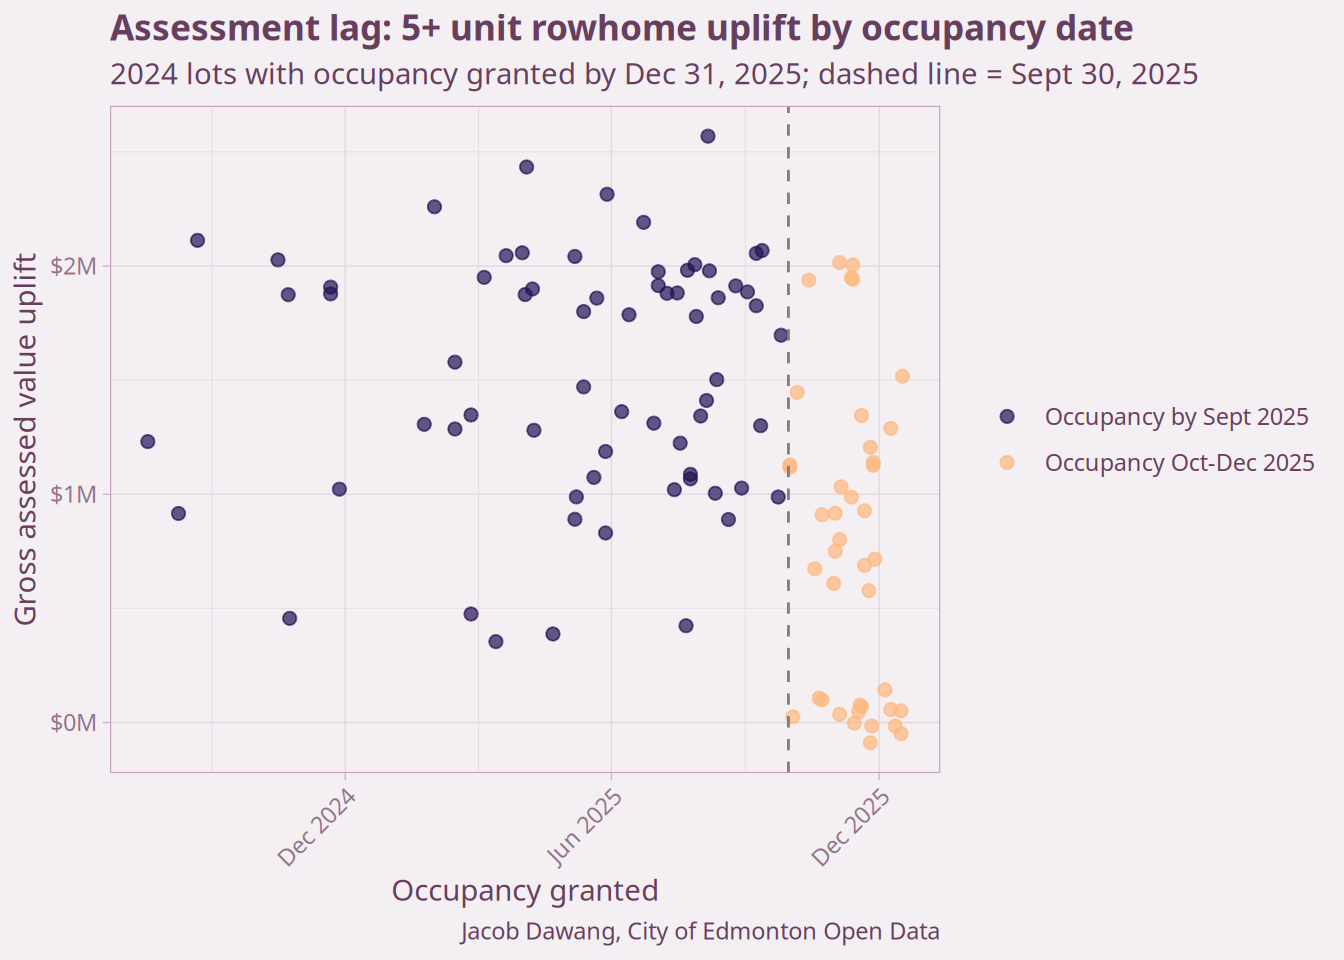
Before treating every occupancy-granted building as “complete” in the 2026 data, it’s worth checking whether the assessments actually keep up with late-year completions. Figure 2 plots each matched lot’s gross uplift against its occupancy date. Buildings that received occupancy by roughly the end of September 2025 tend to show the full 5+ unit rowhome uplift. For many October, November, and especially December completions, the uplift is much smaller and doesn’t follow the same pattern — probably because their assessments still reflect an unfinished state.
The measurement cohort for this post is the matched 2024 lots with occupancy granted by September 30, 2025. Everything else, including those October-December completions, goes into the “not yet fully reflected” group.
All together, the measurement cohort is 67 lots. (0 occupancy-eligible lots showed zero or negative gross uplift – a stale or unfinished assessment despite the granted occupancy date – and are excluded from the measured cohort along with everything else below.)
The rest of the 2024 cohort
The 67 lots above only cover 2024-permitted lots whose completed buildings the 2026 assessment has caught up with. The remaining matched lots, 95 of them, are still under construction, finished too late in 2025 for the assessment to reflect, or showed no gross uplift at all despite a granted occupancy date (0 lots in this cohort; see Section 4.1.1). Their 2026 assessed values still tell us something: they capture whatever value the construction had reached — a partial uplift. Table 1 combines both groups into a single, fully-observed total for the 2024 permit year.
| Observed gross uplift | |||
| 5+ unit rowhomes, 2024 cohort | |||
| n | Median gross uplift | Total gross uplift | |
|---|---|---|---|
| In measured cohort | 67 | $1.7M | $102.6M |
| Not yet fully reflected | 95 | $0.7M | $66.2M |
| sum | 162 | $2.4M | $168.8M |
| Jacob Dawang, City of Edmonton Open Data | |||
That gives a fully-observed total of $169M in assessed value uplift already showing up in the 2026 assessment from the 2024 cohort alone. It understates the eventual value of that cohort: the lots in the “not yet fully reflected” group likely still carry a stale, mid-construction assessment rather than the finished-building value — exactly the gap the model-based extrapolation later in this post is designed to estimate.
From gross uplift to a fairer comparison
The raw 2024-to-2026 difference in assessed value overstates redevelopment’s effect, because Edmonton property values were generally rising over that period anyway. To isolate the redevelopment effect, I build a comparison: what would each property have been worth in 2026 if it hadn’t been redeveloped? I estimate this from a group of RS-zoned properties in mature neighbourhoods that were not part of any 2024-2026 residential new-build permit, taking the median ratio of their 2026 to 2024 assessed value as a general appreciation factor. This un-redeveloped control group may not have appreciated at the rate the redeveloped lots would have, but it’s good enough for a blog post.
Across 77,474 non-redeveloped RS Zone properties in mature neighbourhoods, the median 2024-to-2026 growth ratio is 1.19x, meaning a typical mature-neighbourhood house that wasn’t touched still gained about 19% in assessed value over those two years. I use this as the baseline against which redevelopment uplift is measured.
This brings us to the two measures of assessed value uplift. Net uplift is the completed 5+ unit rowhome’s 2026 value minus 1.19 times its 2024 baseline, isolating the redevelopment effect from general market appreciation. Gross uplift is the simple, unadjusted difference, shown alongside it for comparison.
Figure 3 shows the distribution of both measures across the 67 matched lots, split by project size. There is not much difference between gross and net uplift, because redevelopment multiplies a lot’s value while general market appreciation is comparatively small.
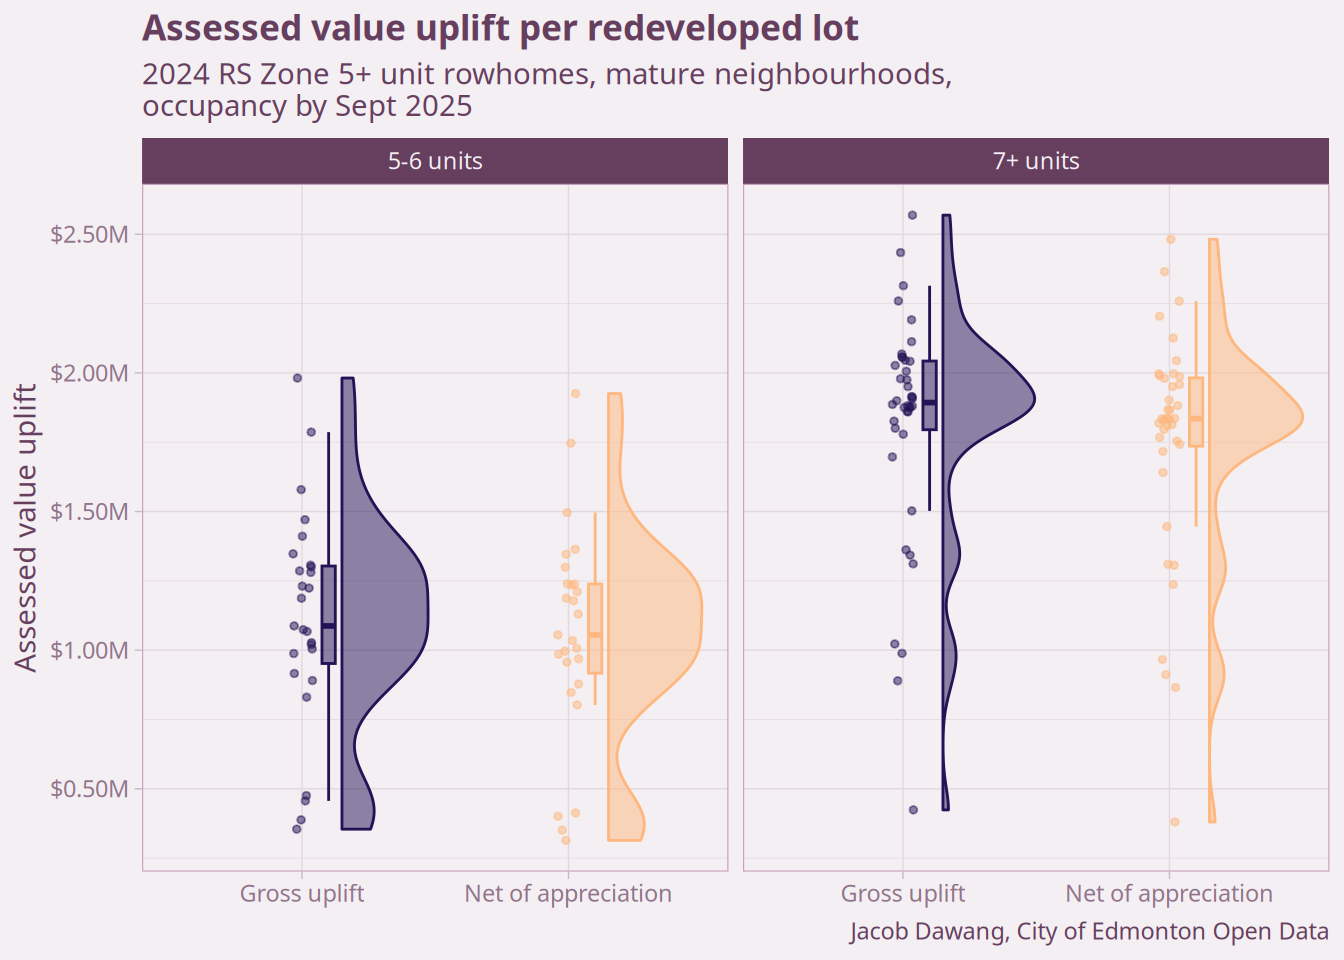
Table 2 compares three simple ways of summarizing this uplift into a single per-project figure: a median per lot within two size buckets (5-6 units and 7+ units), a single median per lot across all sizes, and a median per home added, which can be scaled by any project’s unit count. These serve as sanity anchors for the model-based rule developed next.
| Three uplift rules compared | |||
| 5+ unit rowhomes, measured from the completed 2024 cohort | |||
| n | Median gross uplift | Median net uplift | |
|---|---|---|---|
| 5-6 units | 27 | $1.1M | $1.1M |
| 7+ units | 40 | $1.9M | $1.8M |
| All together | 67 | $1.7M | $1.6M |
| Per home added | 67 | $0.2M | $0.2M |
| Jacob Dawang, City of Edmonton Open Data | |||
Applying the same method to plexes and backyard homes
The same matching-and-consolidation machinery walked through above for the 5+ unit rowhome — legal-key join, 25m geo-fallback, civic-address fallback, same-lot consolidation, split-lot baseline sharing, occupancy cutoff, counterfactual growth adjustment — has already been applied across all three categories together (Section 3.2). Backyard homes are structurally different from the other two: they add a suite behind a retained house rather than replacing it, so their uplift is a smaller, additive effect rather than a full-lot redevelopment.
That yields a completed, measured cohort of 74 2 to 4 unit plexes and 54 backyard homes, alongside the 67 5+ unit rowhomes measured above — 195 lots in total to fit a model on. (The same zero-or-negative-uplift exclusion applies here too: 1 occupancy-eligible plex lots and 0 backyard-home lots are dropped for the same reason as the rowhome cohort above.)
A model for uplift
The simple rules above ignore everything about a project except its unit count. But uplift plausibly varies with location too: land near LRT stations and in more expensive neighbourhoods could command different completed values. So alongside the flat medians, I fit a single model of gross uplift on units added, distance from the nearest LRT stop, the neighbourhood’s median RS-zone assessed value, and a backyard-home indicator. I use a generalized additive model (GAM) rather than a plain linear regression for its flexibility.
Checking against Table 2, the model’s average predicted uplift across the measured 5+ unit rowhome cohort alone is $1.5M per property, in line with the simple rules. What the model adds is prediction accuracy, which matters when extrapolating to hundreds of lots whose size mix and geography differ from the measured cohort’s.
For net uplift, the counterfactual adjustment is applied after prediction: a lot’s predicted net uplift is its predicted gross uplift minus 0.19 times its own 2024 baseline value, the same adjustment used for the measured cohort.
What all this infill is worth
To go from the measured cohort to the full pipeline, I apply the model’s predictions to the non-measured lots: the rest of the 2024 cohort (lots that didn’t match or aren’t fully assessed yet), and lots from 2025 and 2026.
Note
Model predictions are steady-state estimates of uplift: the eventual outcome once construction wraps up and a future assessment incorporates the finished product.
The permit data only runs through June 2026, so I project the rest of 2026 the same way as the Q2 2026 building permit report: scale H1 2026 counts up by 2.1x, the median ratio of full-year to H1 residential units across past years.
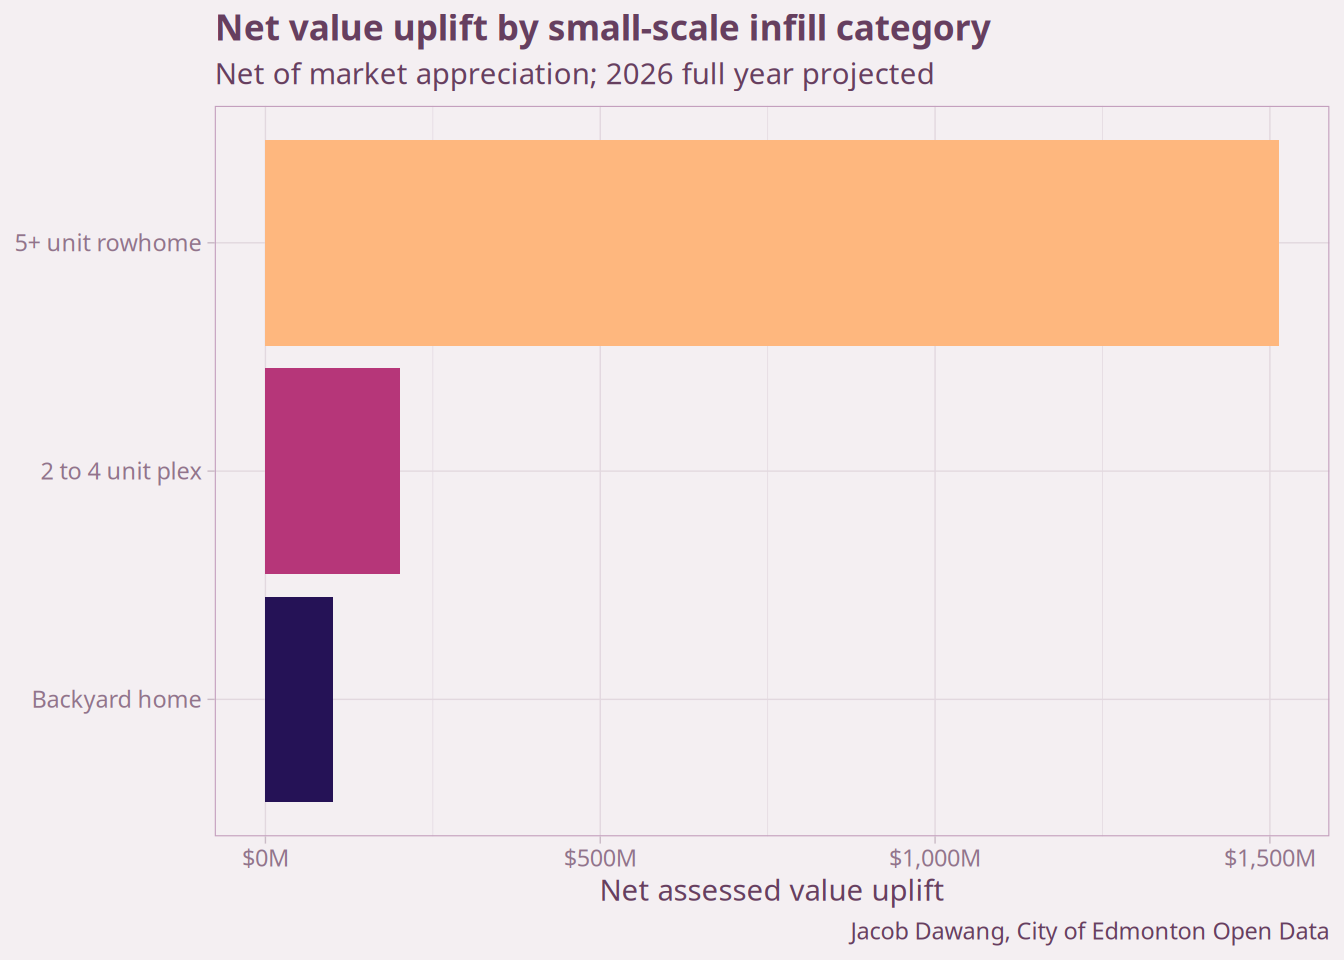
Figure 4 plots the net value uplift side by side. The 5+ unit rowhome dominates, both because it adds the most units per lot and because it’s been the more common redevelopment path since ZBR, but 2 to 4 unit plexes add a meaningful share on their own. Backyard homes add little to the assessment base, given their smaller scale.
Of the $1.82B total, $160M (9%) is already sitting in the 2026 assessment roll from the three measured cohorts; the rest is the pooled model’s projection for lots not yet fully assessed and the 2025–2026 pipeline.
The corresponding tax revenue, in Table 3, comes to an estimated $14.9M a year in additional municipal tax revenue at steady state.
| RS Zone infill property assessment and municipal tax uplift | ||||
| 2024 through H1 2026 building permits (2026 full year projected) | ||||
| Lots | Homes added | Net value uplift | Annual municipal tax uplift | |
|---|---|---|---|---|
| 5+ unit rowhome | 979 | 7,257 | $1,513.2M | $12.5M |
| 2 to 4 unit plex | 373 | 1,085 | $200.9M | $1.6M |
| Backyard home | 215 | 308 | $101.0M | $0.8M |
| sum | 1,567 | 8,650 | $1,815.1M | $14.9M |
| Jacob Dawang, City of Edmonton Open Data | ||||
That’s more than pocket change for the City. The infill tax uplift would cover all of the following items in the 2026 operating budget that materially improve Edmontonians’ quality of life:
- Bus Service Growth Operating Impacts ($7.4M) — the ongoing annual cost of converting three On-Demand Transit zones to conventional fixed-route bus service, using 25 new buses and adding 62,500 annual service hours. This is the ongoing, permanent cost once the new routes launch in 2027, not the smaller, partial-year cost in 2026.
- DATS Service Level ($3.0M) — DATS (Dedicated Accessible Transit Service) is the door-to-door transit option for Edmontonians who can’t use conventional buses or LRT. Demand had outgrown the existing budget. Without this funding, the share of trip requests the city could confirm was projected to fall from 98% to 89%, denying an estimated 120,000 rider trips a year.
- Spring Sweep equipment ($1.1M) — restores funding for the leased equipment used in Edmonton’s annual spring street sweep, which clears the winter’s accumulated sand and grit off roads by June 1 each year.
- Transit Fleet Maintenance ($1.1M) — covers higher-than-budgeted cost increases (about 22%) on the parts and materials needed to keep ETS’s 900+ buses on the road, including legislated preventative maintenance and mid-life refurbishment.
- Bus Cleaning Service Delivery Model ($1.2M) — reinstates a bus-cleaning budget cut in 2020 and never fully restored. Without it, 20 cleaning staff would be cut, risking unsanitary buses, reduced rider satisfaction, and lost ridership and fare revenue.
- Facility Maintenance Services ($0.6M) — covers inflation-driven cost increases (about 15%) on contracted maintenance work at City Hall, recreation centres, police stations, and libraries.
- Infill Liaison Team ($0.6M) — reinstates a dedicated team to field infill-related complaints, explain the City’s infill policy, and coordinate between departments. A fitting one to fund with infill’s own tax revenue.
Alternatively, this infill tax uplift is equivalent to roughly a 0.7% reduction in the property tax rate, which would be a welcome relief for all property owners in Edmonton.
Based on $11M for Explore Edmonton being worth 0.5% of property tax rate
Conclusions
The RS Zone’s small-scale infill isn’t just adding homes — it’s growing the property tax base. Some 1,600 redevelopments over the past two and a half years, built in mature areas that already have the pipes, roads, and schools in place, will be worth $14.9M a year in additional municipal property tax capacity once they’re all built and fully assessed. That’s equivalent to a 0.7% cut in the property tax rate — real relief for every property owner in the city, with more to come as mature-neighbourhood infill continues through 2027 and beyond.
Now it’s up to Council to decide what to do with the ever-growing infill dividend. Whether it goes to keeping property taxes lower or to better service levels, all Edmontonians will profit from the Zoning Bylaw Renewal for years to come. If you’d like to help keep it that way, join me at Grow Together Edmonton where we advocate for building more housing options in the places people want to live.