2025 is over and what a year it was for housing in Edmonton! In 2025, we found the missing middle, permitted a record number of homes, and permitted a record proportion of homes near our LRT stations. This is a testament to the power of zoning reform to drive equitable and sustainable growth.
Without a doubt, the data shows that this is the result of Edmonton’s Zoning Bylaw Renewal (ZBR) that came into force in 2024, with the newly legalized five-to-eight-unit rowhomes in mature neighbourhoods driving a ton of the increase. At the same time, the magic of density has ensured that less than 0.4% of RS-zoned properties in mature neighbourhoods were redeveloped into five-to-eight-unit rowhomes. While a lot of homes have been permitted, not many properties have been affected. It’s not the “avalanche” of infill you often hear about in the media.
However, we can’t just say “mission accomplished” and let things backslide. This is just one year of homebuilding and is a drop in the bucket for our housing stock. With City Council once again considering reducing the number of homes permitted per lot in February, we have to ensure that we keep our foot on the gas. What we’re doing is working: we just need to continue. If you agree, consider joining Grow Together Edmonton to help us advocate for more housing choice, and a better way to grow.
In the rest of this blog post, I summarize the key facts, briefly describe the data sources, then go into the details.
Edmonton issued building permits for a record number of homes in 2025, over 17,500.
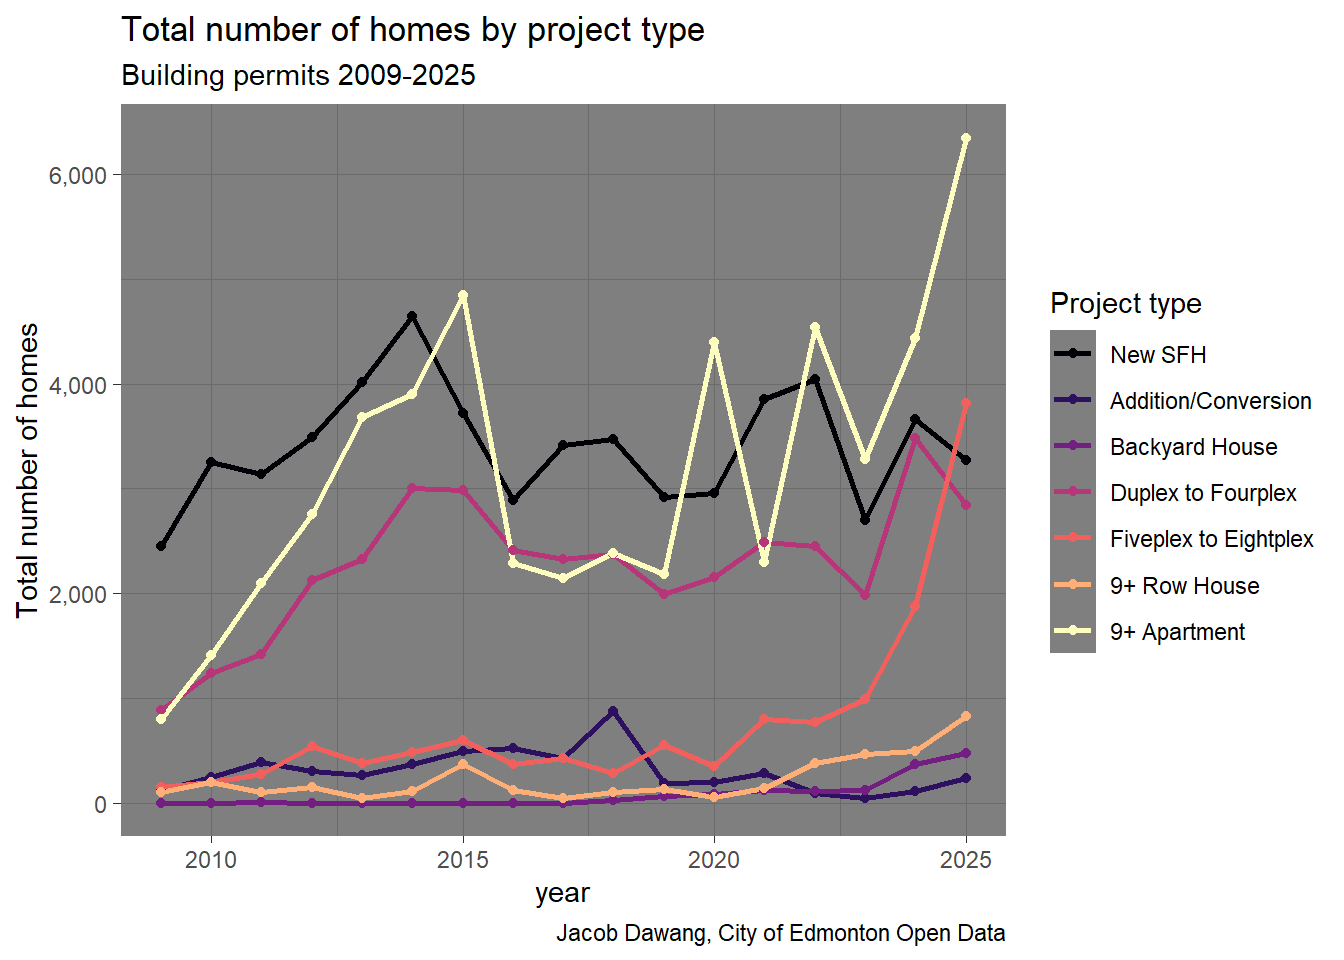
For the first time since the beginning of the dataset, more homes were permitted in rowhomes between 5 and 8 units than single family homes.
The number of homes permitted in mature neighbourhoods almost equaled the number of homes permitted outside the Henday. It has never been close before.
The magic of density means few properties need to be redeveloped to build a ton of homes: only 0.2% of properties across the RS Zone, and 0.4% within mature neighbourhoods were permitted to redevelop into 5 to 8 unit townhomes.
Allowing eight homes per lot is critical: Projects with exactly eight units accounted for the vast majority of homes in the 5-8 unit category in the RS Zone.
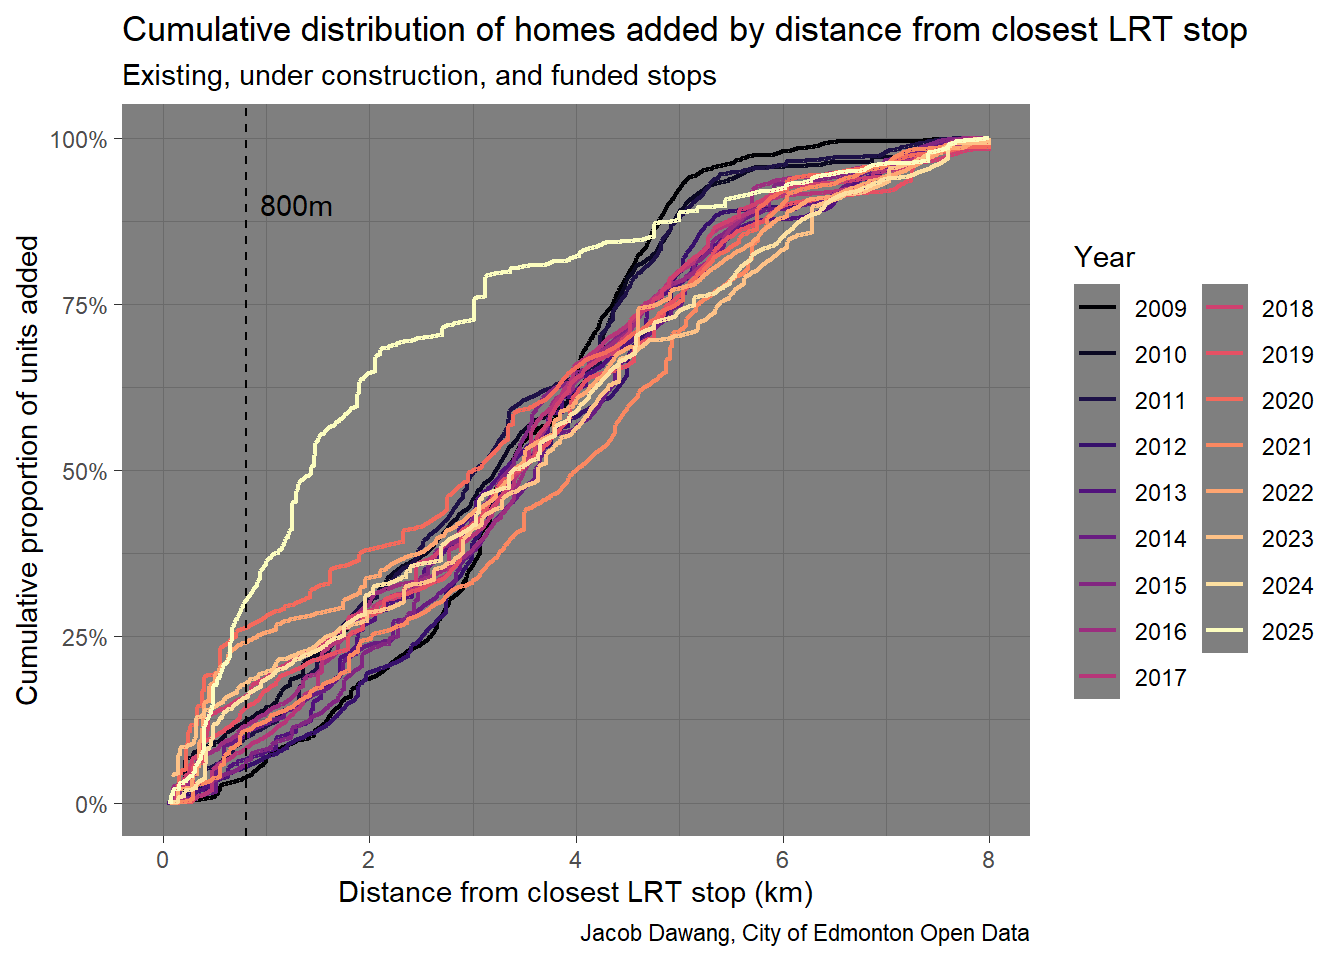
2025 was the best year on record for building homes near transit. 30% of homes were permitted within 800m, approximately a 15 minute walk, of transit.
Edmonton’s general building permit data has tracked building permits since 2009. It contains columns for building type, work type, location, units added, and more for each building permit. This data and processing is the same as in previous posts, so you can read those for more information.
Edmonton’s property assessment data contains one row per property assessed with columns for neighbourhood, and zoning. I use it to count the number of properties in mature neighbourhoods under RS zoning.
As well, Edmonton’s LRT and future LRT network, definition of mature neighbourhoods, and the Henday boundaries are easily downloadable online.
The RS Zone was introduced in January 2024 as the primary residential zone for Edmonton’s established neighborhoods. It replaced several restrictive zones (RF1, RF2, RF3, and RF4) to simplify the development process for “missing middle” housing, such as duplexes, row houses, and small apartment-style builds. The key restrictions in this zone are:
75 m2 lot area per unit. E.g., if you want to build six homes on a lot, you need a \(6 \times 75 = 450\) m2 lot.
An 8 home per lot hard cap on non-corner/interior/midblock lots.
After 18 months of implementation, Edmonton City Council enacted a number of changes in July 2025. While the size of permitted buildings was significantly reduced, the potentially most damaging change proposed, reducing the hard cap on number of homes per lot to 6, failed.
Unfortunately, Edmonton City Council will be reconsidering reducing the number of homes per lot to 6 once more this year.
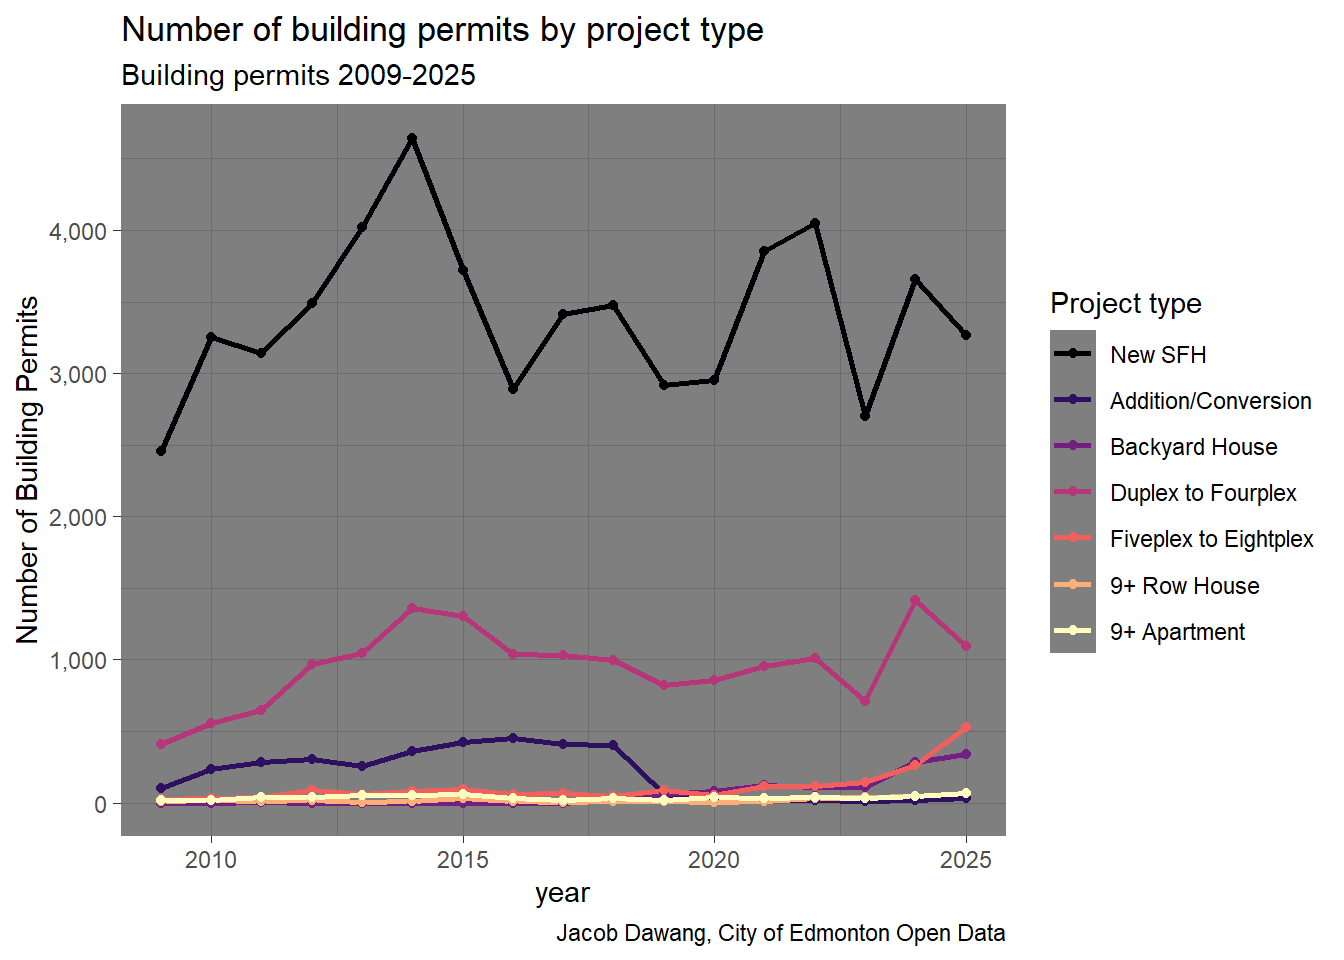
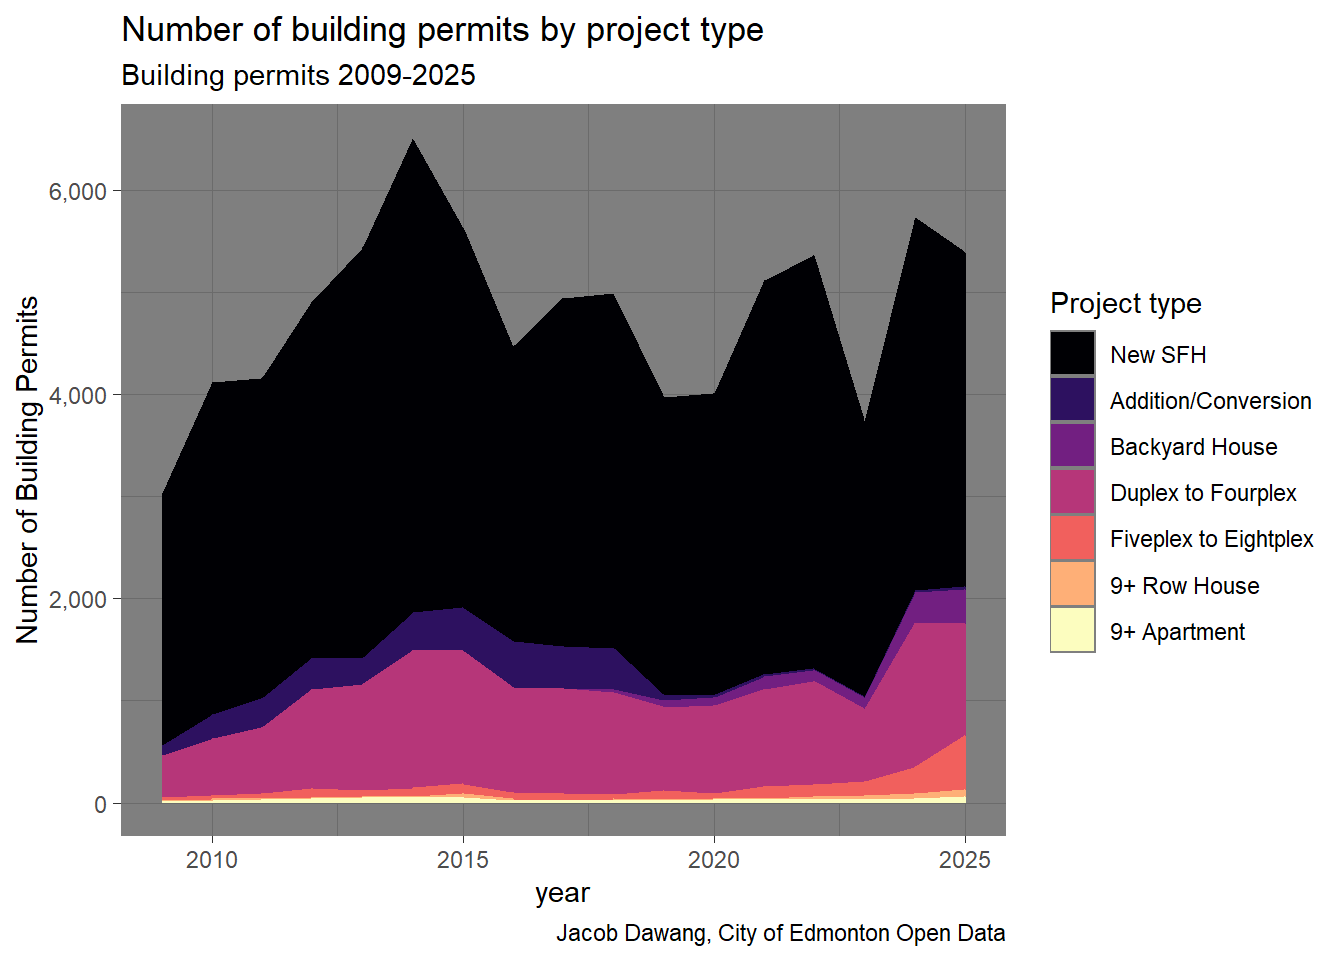
Alright, back to the data. First, let’s look at the timeseries of building permits and units added by project type. Figure 2 shows the raw number of building permits issued and Figure 3 shows the corresponding number of homes added.
It’s been a huge year for Edmonton. We broke records. We permitted more homes in 2025 than ever before, and increasingly of “missing middle” type, providing options between large-scale apartments and single-family homes. For the first time ever, more homes were permitted in the five-to-eight-unit rowhouse category than single family homes, as the lines cross in Figure 3 (a).
The axes are different between the line plots and area plots below.

In Figure 4, we can see that 5-8 unit rowhomes and 9+ apartments drove the increase in homes in 2025. While 9+ apartments have historically reached the same scale as in 2025, the rise of 5-8 unit rowhomes is astounding. There is no other explanation except that Edmonton legalized 5-8 unit rowhomes in mature neighbourhoods at the exact right time, when demand was highest.
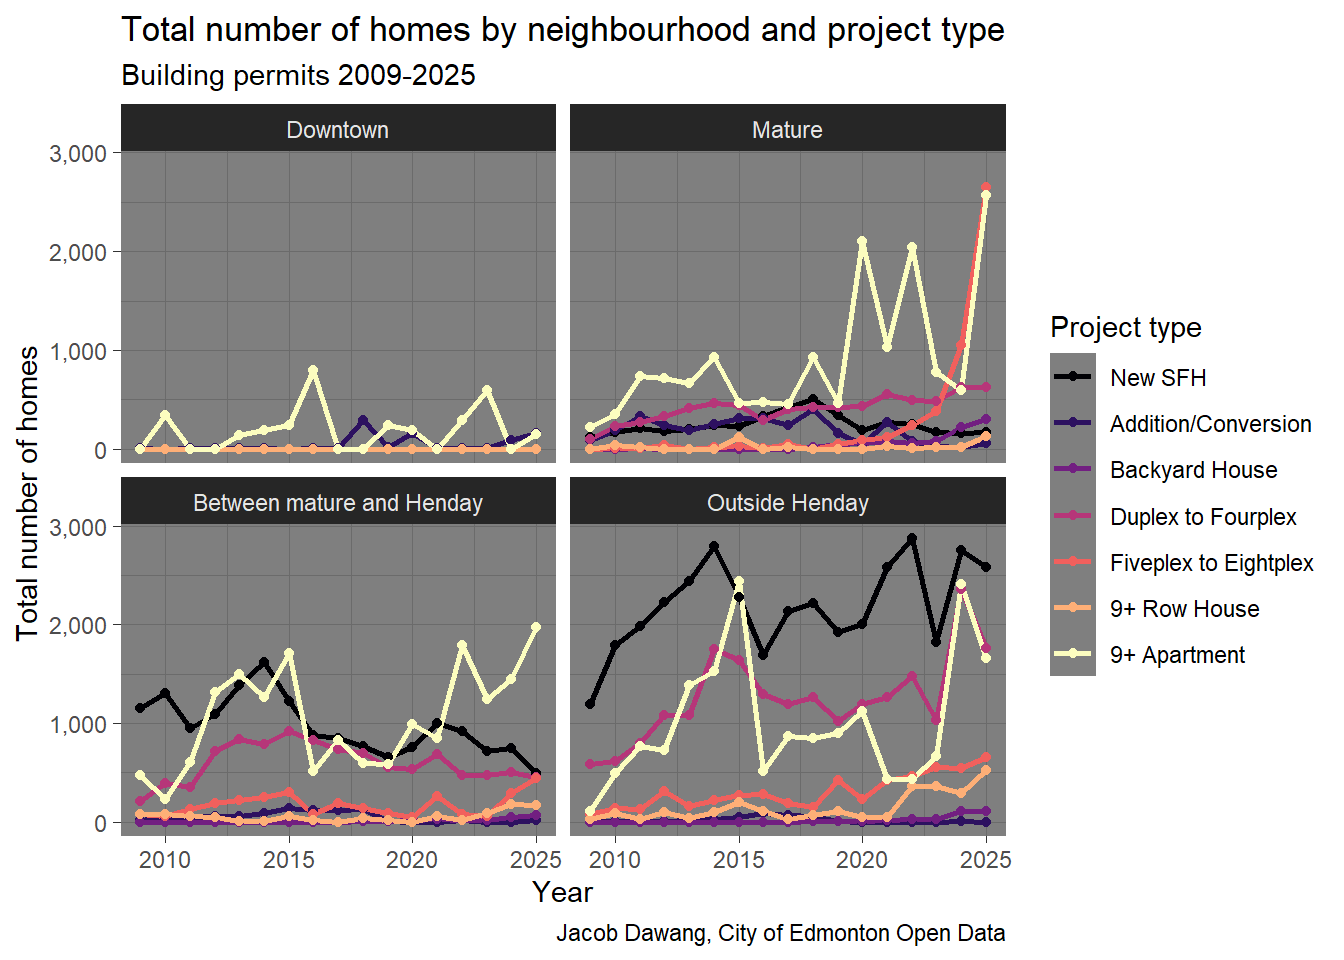

This should also put the myth of “everyone wants ownership of a single-detached homes with a yard” to bed. Clearly, there is a huge number of people who would prefer to rent a townhome in a mature, central neighbourhood than be forced into a single-detached home in a new suburb. We permitted so many homes to be built in mature neighbourhoods, not because it’s cheaper or easier than building a new single-detached home in greenfield, but because people desperately want to live in mature neighbourhoods, no matter the housing type. Providing people the option to live in their preferred neighbourhood at an affordable rate is a good thing, and Edmonton’s zoning changes have started to enable this.
So far, I have grouped 5 to 8 unit rowhomes together. How many are exactly eight units? Looking at the RS Zone specifically, we can see in Table 1 exactly eight homes is the most commonly permitted, and is the driver of the increase in the category of 5 to 8 unit rowhomes.
| Number of permits and homes added by number of units permitted | ||
| 2025 building permits | ||
| Number of homes added in permit | Number of permits issued | Total number of homes added |
|---|---|---|
| 5 | 16 | 80 |
| 6 | 45 | 270 |
| 7 | 26 | 182 |
| 8 | 228 | 1824 |
| Jacob Dawang, City of Edmonton Open Data | ||
Besides the direct effect on housing supply and affordability, Edmonton’s zoning changes have enabled more people than ever to live close to transit. That means fewer people driving, less congestion, and less greenhouse gas emissions. In 2025, more homes were permitted close to transit than ever before. Figure 5, shows just how differentiated 2025 is. Besides permitting 30% of homes within 800m of transit, a record high for this threshold, the entire cumulative distribution is bowed up and to the left. That means we’re building substantially closer to transit than ever before. Even if people don’t live within walking distance, more people are going to have options that are a short bus ride or bike ride away.
Once again, it is 5-8 unit rowhomes in the RS Zone that is driving more homes to be built near transit. Breaking out a map in Figure 6, we can see that the 5-8 unit rowhomes follow the path of the LRT almost religiously, especially the Valley Line West.
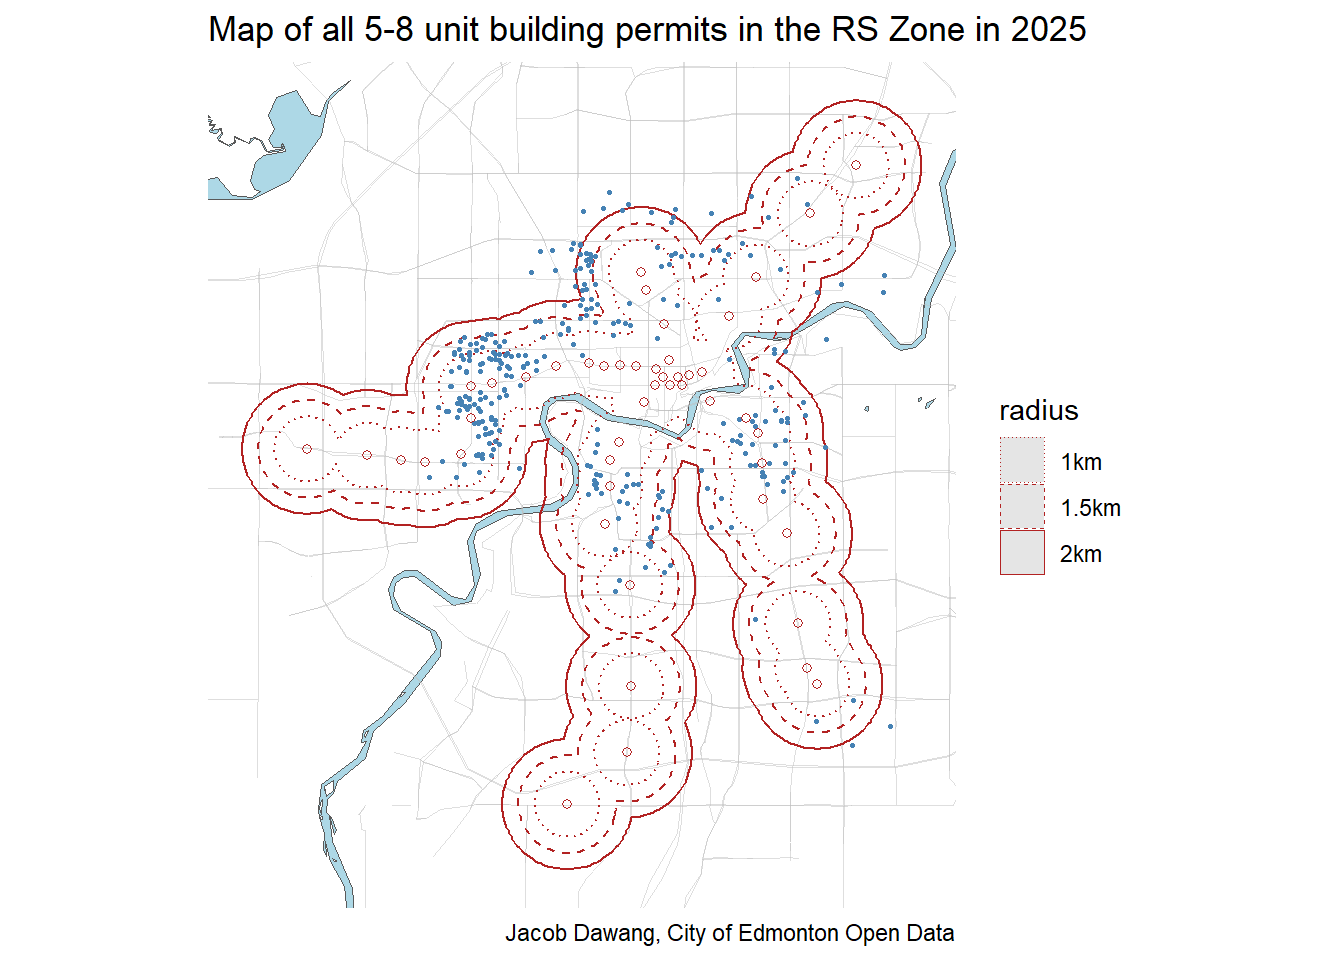
Figure 7 confirms around 50% of 5-8 unit rowhomes permitted in 2025 were within 800m of an LRT stop. 2025 is even an improvement over 2024, with the distribution bowed out and to the left.
Despite the impressive number of homes built, the number of properties redeveloped for this increase in housing produced is nowhere near as significant. That’s the magic of density: a few hundred redeveloped properties can produce thousands of homes for people. Let’s check the rate of redevelopment using property assessment data.
In Table 2, we see that: there is no “avalanche” of infill. Even in mature neighbourhoods, less than 1 in 200 homes have been redeveloped into a 5 to 8 unit rowhome. Compared to the total housing and property stock, the impressive building in 2025 is a drop in the bucket. It will take many years of building under these rules to truly provide a balance of housing options for people in all neighbourhoods.
| RS Zone intensity: comparing property redevelopment rates to housing gains | ||||
| 2025 building permits | ||||
| Neighbourhood type | Number of 5-8 unit permits | Number of properties | Percent of properties redeveloped | Number of homes added |
|---|---|---|---|---|
| Mature | 310 | 80,050 | 0.39% | 2,321 |
| Between mature and Henday | 5 | 66,204 | 0.01% | 35 |
| Outside Henday | 0 | 2 | 0.00% | 0 |
| Jacob Dawang, City of Edmonton Open Data | ||||
We can drill down deeper into the rate of redevelopment by individual neighbourhood in Table 3. Concentrating on a handful of neighbourhoods that have been held up as examples of new rowhomes “destroying the neighbourhood”, we can see some variation in the proportion of properties redeveloped. Nevertheless, rowhomes remain relatively rare in these neighbourhoods. Furthermore, these are all neighbourhoods that have lost population from 50 years ago. Some are as much as 30% less populated, which is yet another reason why infrastructure capacity is not a barrier to adding more homes to existing neighbourhoods. The new rowhomes are simply repopulating these neighbourhoods back to their design capacity.
| Selected neighbourhood 5-8 unit development profiles | ||||||||
| RS Zone, 2025 building permits | ||||||||
| Neighbourhood | Ward | Number of 5-8 unit permits | Number of properties | Percent of properties redeveloped | Number of homes added | Population 2021 | Population 1971 | Population change |
|---|---|---|---|---|---|---|---|---|
| Belgravia | papastew | 8 | 702 | 1.14% | 61 | 2,220 | 2,940 | −24% |
| Britannia Youngstown | Nakota Isga | 13 | 895 | 1.45% | 104 | 4,350 | 4,590 | −5% |
| Crestwood | Nakota Isga | 4 | 866 | 0.46% | 30 | 2,415 | 3,445 | −30% |
| Glenwood | Nakota Isga | 20 | 993 | 2.01% | 160 | 4,960 | 5,650 | −12% |
| Grovenor | Nakota Isga | 17 | 943 | 1.80% | 120 | 2,585 | 3,100 | −17% |
| Mckernan | papastew | 7 | 883 | 0.79% | 46 | 2,580 | 2,840 | −9% |
| Parkview | sipiwiyiniwak | 2 | 1,400 | 0.14% | 12 | 3,375 | 5,735 | −41% |
| Westmount | O-day'min | 7 | 1,125 | 0.62% | 56 | 6,165 | 7,450 | −17% |
| Jacob Dawang, City of Edmonton Open Data, StatCan Census | ||||||||
I’ve created an interactive version in Table 3 so you can search up your own neighbourhood or any other you may be interested in. Pay attention to just how many neighbourhoods had zero 5-8 unit rowhomes permitted in 2025.
In case you’re interested in the cumulative statistics since ZBR was implemented in 2024, you can look it up in Table 5.
The data from 2025 tells a story of a city finally finding its balance. For decades, Edmonton’s growth was pointed one direction: outwards into greenfield. By legalizing the “missing middle,” we haven’t just changed the zoning code, we’ve given people more choice to live their lives where it makes sense for them. We’ve done this through building townhomes near transit, walkable infill, and diverse housing choices in the neighborhoods people love most.
We have proven that we don’t need to “destroy” neighborhoods to house our neighbors. By redeveloping just 0.4% of RS-zoned properties in mature areas, we added thousands of homes, which will start to bring life back to communities that have seen their populations dwindle by 20% to 40% since the 1970s. This is the definition of sustainable, efficient growth.
Despite this record-breaking success, our progress is fragile. In February, City Council is expected to once again consider a proposal to reduce the hard cap on homes per lot from eight down to six, along with multiple other red
If the data shows us anything, it’s that the 8 home rowhome is the primary engine of our current success. To cap it now, just as it has begun to outpace single-family home construction, would be to intentionally stall Edmonton’s momentum. It would mean fewer homes near transit, higher infrastructure costs for the city, and fewer options for the next generation of Edmontonians.
We cannot afford to let the narrative of an “infill avalanche” win when the data clearly shows a measured, successful transition.
Share this analysis: Use these numbers to show your neighbours and your Councillor that the Zoning Bylaw Renewal is working exactly as intended.
Get involved: This February, Council needs to hear from the people who benefit from these new homes. Join Grow Together Edmonton to stay updated on how to advocate for housing choice.
2025 was the year we found the missing middle. In 2026, let’s make sure we have the courage to keep it.